So, you've trained a machine learning model. The accuracy metrics look great, and it's performing like a champ in your Jupyter Notebook environment. That's a huge milestone, but it's really just the first leg of the race.
The real test—and where the genuine value lies—is getting that model out of the lab and into the wild. This is the world of machine learning model deployment, the critical process of transforming a research artifact into a living, breathing application that serves predictions and solves real problems.
From Notebook to Production Value

This is where the rubber meets the road. It's about bridging the gap between the clean, controlled space of your notebook and the messy, unpredictable nature of a live production system. A model that's a genius on your local machine can easily stumble when faced with real-world complexities.
Honestly, this transition is often less about data science and much more about solid engineering and operations. A lot of promising projects hit a wall right here.
The Deployment Disconnect
It’s a surprisingly common story. A team builds a fantastic model, but it never makes it into production. The stats back this up: while around 85% of organizations are dabbling in machine learning, only a small fraction—roughly 20%—successfully deploy their models. This gap highlights just how tough it is to turn a great idea into a practical tool.
What's causing this disconnect? It usually boils down to a few familiar culprits:
- Environment Mismatches: The classic "it works on my machine" syndrome. For example, your model was trained using
scikit-learnversion 1.0.1, but the production server has version 0.24.2. This can cause subtle prediction differences or even crash the application entirely due to an unavailable function. - Scalability Nightmares: Your model might work perfectly on a tidy, static dataset. But can it handle thousands of simultaneous requests from a mobile app during a marketing campaign? Without a scalable architecture, you're looking at slow response times and a terrible user experience.
- Manual Overload: Deploying by hand is slow, tedious, and a recipe for human error. For instance, a developer might forget to update an environment variable when copying files to the server, causing the application to fail. Without a solid, automated pipeline, every single update or bug fix becomes a high-stakes, time-consuming chore.
Let's take a look at the key stages involved in a typical deployment lifecycle to understand the full journey.
Key Stages of the ML Model Deployment Lifecycle
This table outlines the essential phases of taking a model from a developer's machine to a live, production-ready system.
| Stage | Objective | Key Activities & Practical Example |
|---|---|---|
| Model Packaging | To create a self-contained, portable artifact of the model. | Containerizing a fraud detection model with Docker, ensuring the Dockerfile lists the exact versions of pandas and tensorflow used in training. |
| Infrastructure Setup | To provision the necessary hardware and software environments. | Configuring an Amazon EC2 instance with the right security group rules to allow web traffic, or setting up a Kubernetes cluster on Google Cloud. |
| CI/CD Pipeline | To automate the build, test, and deployment process. | Using GitHub Actions to automatically build a Docker image and deploy it to AWS Elastic Container Registry every time code is merged into the main branch. |
| Model Serving | To expose the model via an API for real-time predictions. | Wrapping a sentiment analysis model in a FastAPI application with a /predict endpoint that accepts text and returns a JSON response like {"sentiment": "positive"}. |
| Monitoring & MLOps | To track performance and maintain the model over time. | Using Prometheus to monitor API latency and Evidently AI to compare the distribution of incoming user ages against the training data to detect data drift. |
Understanding these stages reveals that a successful deployment is far more than just getting the model onto a server; it's about building a robust, end-to-end system.
A successful deployment strategy isn't just about pushing a model file somewhere. It's about building a repeatable, reliable, and observable system that can evolve with your data and business needs.
This guide is designed to walk you through building that exact system. We'll cover everything from packaging your model with Docker to setting up automated CI/CD pipelines. By the end, you'll have the practical knowledge to turn your theoretical models into dependable, scalable assets that deliver real-world impact.
Packaging Your Model for Production

Before your model can ever see a live environment, it has to be packaged into a stable, portable unit. This is the bedrock of any serious machine learning model deployment. It’s the process that turns a messy collection of code and weights into a clean, self-contained artifact ready for the real world.
The whole journey starts with saving—or serializing—your trained model. You're essentially taking a snapshot of the model object from your training script and saving it to a file. This captures all the learned parameters and the model's architecture, so you don't have to retrain it from scratch every time you need a prediction.
Saving Your Model and Its Dependencies
If you're in the Python ecosystem, the go-to for many is Pickle. With a framework like Scikit-learn, a quick pickle.dump() command saves your entire model to a .pkl file. It’s fast, simple, and it works. For instance, after training a logistic regression classifier named clf, you would save it with pickle.dump(clf, open('model.pkl', 'wb')).
But Pickle has its downsides. It’s notoriously picky about Python and library versions, which can bite you with compatibility issues later on. A more flexible, framework-agnostic choice is the Open Neural Network Exchange (ONNX) format. ONNX is a game-changer because it lets you save a model from PyTorch or TensorFlow and then load it in a completely different environment.
Think of ONNX as a universal translator. It frees your model from the specific framework that created it, giving you a ton more flexibility down the road.
After the model is saved, the next critical step is containerization. This is how you finally solve the dreaded "it works on my machine" problem for good.
Containerization bundles your model, its code, and every single dependency into an isolated package. This package, called an image, runs identically everywhere, guaranteeing consistency from your laptop to the production server.
Building a Self-Contained Unit with Docker
The undisputed king of containerization is Docker. You just write a simple configuration file—the Dockerfile—that acts as a blueprint for your container. This file spells out everything needed to get your application running: the base OS, system-level libraries, all your Python dependencies, and your source code.
This bundling is what makes deployments so reliable. It eliminates surprises by creating a predictable, locked-down environment. Your model will always run with the exact versions of pandas, numpy, and scikit-learn it was trained with. No more weird bugs from subtle environment drift.
For a deeper look at prepping your server for containerization, check out our guide on getting started with a Docker MCP server.
A Practical Dockerfile Example
Let's walk through a real-world scenario. Say you have an image classification model built with TensorFlow/Keras that you want to serve through an API using FastAPI.
Your project directory probably looks something like this:
main.py: The FastAPI code that loads your model and creates the prediction endpoint.requirements.txt: A list of all Python packages (fastapi,tensorflow,uvicorn, etc.).my_model.h5: The saved Keras model file.
Here’s what a solid Dockerfile for this setup would look like:
# Start from an official Python base image
FROM python:3.10-slim

# Set the working directory inside the container
WORKDIR /app

# Copy the file with dependencies first to leverage Docker's layer caching
COPY requirements.txt requirements.txt

# Install the Python dependencies
RUN pip install --no-cache-dir -r requirements.txt

# Copy the rest of your application code and model into the container
COPY . .

# Expose the port the app runs on
EXPOSE 8000

# Define the command to run your application when the container starts
CMD ["uvicorn", "main:app", "--host", "0.0.0.0", "--port", "8000"]
This Dockerfile creates a lean, reproducible image of your application. It methodically installs dependencies, copies your code, and defines exactly how to run the FastAPI server.
With this one file, anyone on your team can build and run your exact application environment with two simple commands: docker build -t my-model-api . and docker run -p 8000:8000 my-model-api. This packaged image is now the golden artifact you'll push through the rest of your deployment pipeline, ensuring what you tested is exactly what goes live.
Choosing the Right ML Deployment Strategy
Okay, you’ve got your model all packaged up and ready to go. Now for the million-dollar question: where and how are you going to run this thing?
There’s no magic bullet for machine learning model deployment. The best approach is always the one that fits your specific needs. It's a classic balancing act between speed, cost, and the sheer volume of data you're dealing with.
Let's walk through the three main ways people deploy models in the wild so you can figure out which one makes the most sense for you.
Real-Time Online Inference
Real-time inference is all about instant gratification. When a user—or another system—needs a prediction right now, this is your go-to. The model is deployed as a live API endpoint, always on and ready to process single requests or small batches of data, spitting back a prediction in milliseconds.
Think about a credit card fraud detection system. When someone swipes their card, the system can't take a five-minute coffee break to decide if the transaction is legit. It needs an answer on the spot. A practical example is an API that receives a JSON payload with transaction details (amount, merchant_id, time) and immediately returns {"is_fraud": true}.
This approach is perfect for:
- Interactive Applications: Like the recommendation engines on e-commerce sites that suggest products as you browse.
- Critical Alert Systems: Think of systems that flag suspicious login attempts or spot defects on a factory assembly line.
- Dynamic Pricing: Where prices need to shift instantly based on live market data.
The big trade-off here is cost. Keeping a server fired up 24/7 to handle requests isn't cheap, and you need infrastructure that can handle sudden traffic spikes without crashing.
Batch Inference For Scheduled Predictions
At the other end of the spectrum, we have batch inference. Instead of being "always on," this strategy runs your model on a set schedule—maybe hourly, daily, or even weekly—to chew through a massive amount of data all at once. The predictions are then saved to a database or file system for someone to use later.
A great example is a customer churn prediction model. You don't need to know every single second whether a customer is thinking about leaving. Instead, you can run a big batch job every Sunday night. This job could be a Python script running on a cron schedule that reads all active customer data from a database, generates predictions, and writes the results to a new table called customer_churn_risk. That list of at-risk customers is then ready for the marketing team to work on come Monday morning.
Batch processing is all about throughput and cost-efficiency, not low latency. It’s the workhorse for generating reports, pre-calculating analytics, or any task where an immediate answer isn't a business necessity.
This method is usually way cheaper than real-time serving because you only pay for compute resources when the job is actually running.
Edge Deployments For Ultimate Speed
Edge deployments take speed to a whole new level by putting the model directly on the device where the data is created. Instead of shipping data off to a central server, the model runs locally—on a smartphone, a smart camera, or an industrial sensor. This is a must when latency and spotty internet connectivity are deal-breakers.
Take a self-driving car's object detection system. It has to identify pedestrians and other cars in a split second. Sending video frames to the cloud for analysis would be dangerously slow and unreliable. The model has to run on the car’s own computer. A concrete example is a TensorFlow Lite model embedded in a mobile app that allows for real-time camera effects without an internet connection.
The chart below really drives home just how much latency varies across different setups, showing why edge computing is king for speed.
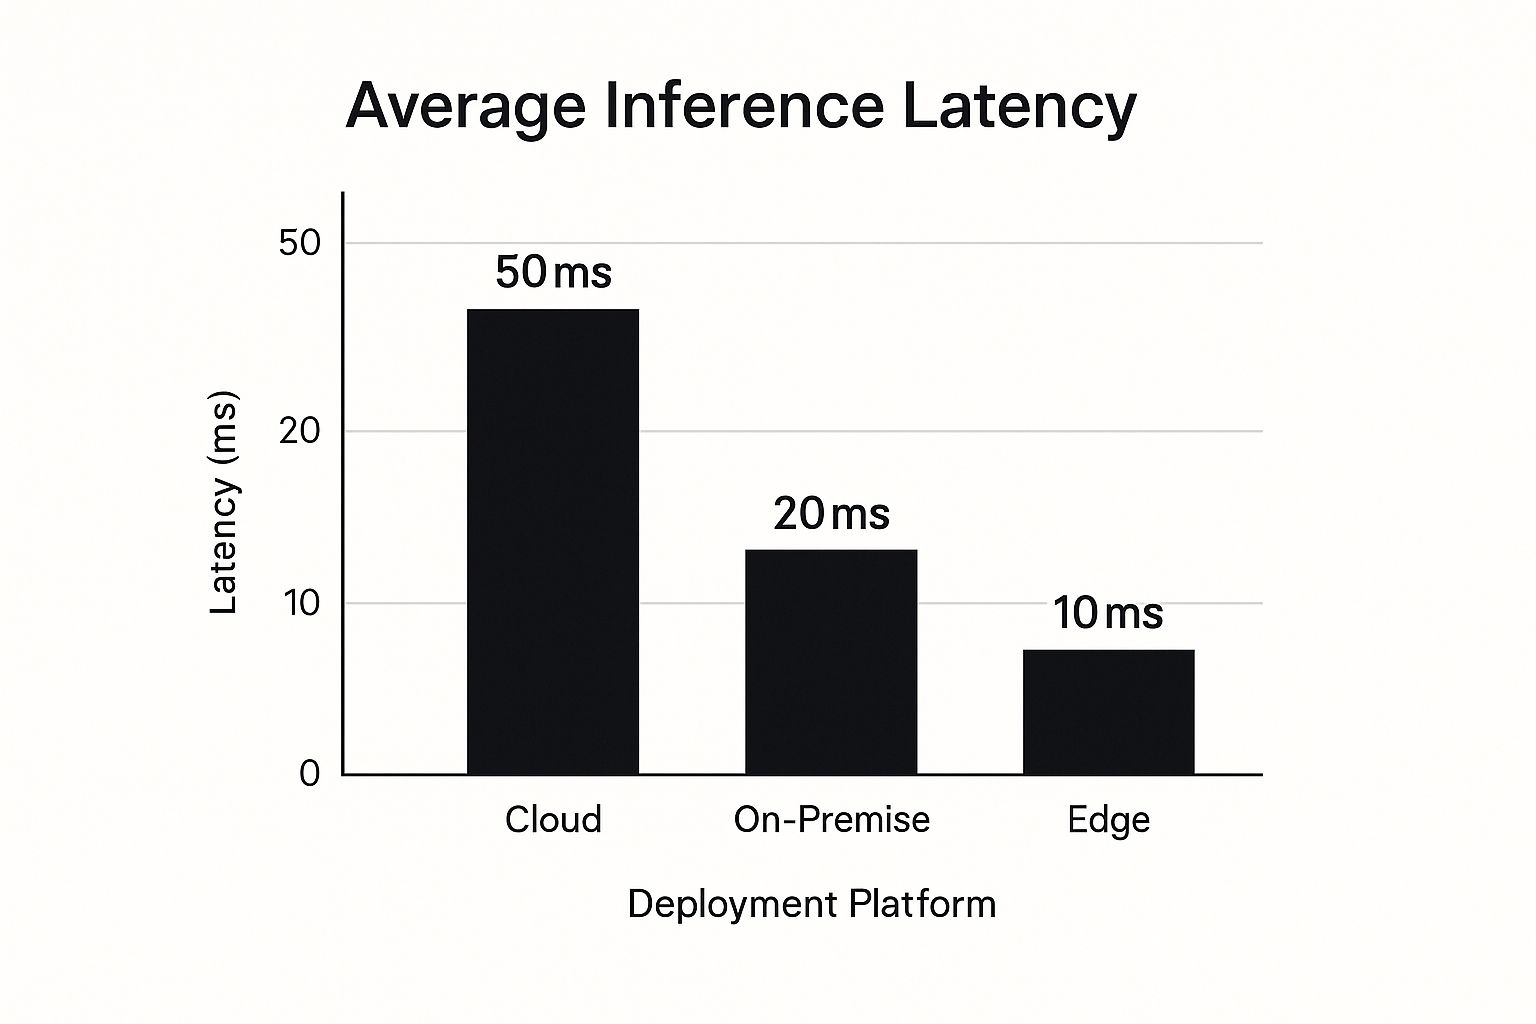
As you can see, by keeping the processing local, edge devices can achieve inference latencies that are 2-5 times lower than what you'd get from on-premise or cloud-based solutions.
The main headache with edge deployments? The limited computing power and memory on these devices. You often have to shrink or seriously optimize your models to get them to run efficiently.
Making The Right Choice
To make a smart decision, you need a clear picture of the trade-offs. This table breaks down the three strategies across the most important factors, giving you a solid framework for picking the best path for your project.
Comparison of ML Deployment Strategies
A breakdown of different deployment patterns to help you choose the best fit for your project's needs.
| Strategy | Best For | Latency | Infrastructure Cost | Example Use Case |
|---|---|---|---|---|
| Real-Time Inference | Immediate, user-facing predictions | Milliseconds | High | A loan application API that instantly approves or denies credit. |
| Batch Inference | Large-scale, non-urgent tasks | Minutes to Hours | Low | A nightly job that calculates personalized product recommendations for all users. |
| Edge Deployment | Offline or ultra-low-latency needs | Sub-milliseconds | Moderate | A smart camera that detects package deliveries at a doorstep. |
Ultimately, choosing the right deployment strategy comes down to aligning your technical setup with what the business actually needs. A fraud detection system demands real-time speed, but a weekly report is a perfect fit for batch processing. By weighing these factors carefully, you’ll build a system that’s not just powerful, but also efficient and cost-effective.
Automating Deployments with CI/CD Pipelines
Manually deploying a model is like building a car from scratch every time you want to go for a drive. It’s painfully slow, rife with opportunities for error, and completely unsustainable if you need to move quickly. This is precisely where MLOps principles—specifically Continuous Integration and Continuous Deployment (CI/CD)—come in to change the game for machine learning model deployment.
A CI/CD pipeline is essentially an automated assembly line that takes your code from a commit in a Git repository all the way to a live production environment. For machine learning, this process has to handle more than just code; it needs to validate data, test the model itself, and package everything up reliably. This automation is what separates a fragile, one-off deployment from a robust, scalable MLOps system.
By setting up this automated pathway, you make deployments fast, predictable, and almost boring. And in the world of deployments, boring is good. No more late-night manual pushes or crossing your fingers and hoping nothing breaks.
The Core Stages of an ML CI/CD Pipeline
A CI/CD pipeline for machine learning has a few extra jobs compared to a standard software pipeline. It’s responsible for the code, the model artifact, and the data it relies on. While the specifics will always vary based on your stack, any solid pipeline will include these critical stages.
- Code & Data Validation: The whole process kicks off when you push new code. The first thing that should happen is running linters (
flake8) and unit tests (pytest) on your source code. For example, a data validation step might use a library like Great Expectations to ensure an incomingagecolumn is always between 0 and 100. - Model Testing: This is a crucial step that often gets overlooked. The pipeline needs to run automated tests on the model itself. For example, after loading the new model, the pipeline could run it against a "golden dataset" of 100 known samples and fail the build if the accuracy is below a 95% threshold.
- Build Container Image: Once all the tests pass, the pipeline gets to work building the Docker image. This uses the Dockerfile in your repository to package your application code, model file, and all dependencies into that consistent, self-contained unit we talked about earlier.
- Push to Registry: The newly built and tagged Docker image is then pushed to a container registry. Think of this as a library for your images, like Docker Hub, Google Container Registry (GCR), or Amazon Elastic Container Registry (ECR).
- Deploy to Target Environment: Finally, the pipeline triggers the actual deployment. It instructs your infrastructure to pull the latest image from the registry and deploy it to your target environment, whether that's a Kubernetes cluster, a cloud service like Google Vertex AI, or even a fleet of edge devices.
The real power of a CI/CD pipeline is its consistency. Every single change, whether it's a minor code fix or a completely new model version, goes through the exact same rigorous, automated validation process before it ever sees production.
This structured approach systematically stamps out the risk of human error, which is almost always the root cause of deployment failures. It gives your team a safety net, allowing them to iterate and innovate much more quickly and confidently.
A Practical Example with GitHub Actions
Let's make this more tangible with a real-world tool. GitHub Actions is a massively popular CI/CD tool that’s built directly into GitHub, making it incredibly easy to automate workflows based on repository events like a push or a pull request.
Imagine your project is set up with your model, application code, and a Dockerfile. You can create a simple workflow file (usually at .github/workflows/deploy.yml) to define your entire pipeline. This file tells GitHub Actions exactly what to do step-by-step whenever you push a change to your main branch.
To create an even more connected ecosystem, you can look into tools designed to work seamlessly with your CI/CD setup. For example, you can learn more about configuring a GitHub Actions MCP server to link your AI tools and workflows together.
Here’s a simplified look at what that deploy.yml file might contain:
name: CI/CD for ML Model

on:
  push:
    branches: [ "main" ]

jobs:
  build-and-deploy:
    runs-on: ubuntu-latest
    steps:
    - name: Check out the repo
      uses: actions/checkout@v3

    - name: Set up Docker Buildx
      uses: docker/setup-buildx-action@v2

    - name: Log in to a container registry
      uses: docker/login-action@v2
      with:
        username: ${{ secrets.DOCKER_USERNAME }}
        password: ${{ secrets.DOCKER_PASSWORD }}

    - name: Build and push Docker image
      uses: docker/build-push-action@v4
      with:
        context: .
        push: true
        tags: yourusername/your-model-api:latest

    - name: Deploy to Production
      run: |
        # Add your deployment command here
        # Example for Kubernetes:
        # kubectl apply -f k8s/deployment.yaml
        # Example for Google Cloud Run:
        # gcloud run deploy my-model-service --image gcr.io/your-project/your-model-api:latest --region us-central1
        echo "Deploying to production..."
This script automates the core build-and-push steps. Every time you push to the main branch, GitHub Actions will automatically fire up, build your Docker image, and push it to a registry. That final step is a placeholder where you’d add the specific command to deploy the new image to your production infrastructure. With this in place, your entire deployment process becomes as simple as a git push.
Monitoring and Maintaining Deployed Models
Getting your model into production is a huge milestone, but don't pop the champagne just yet. The real work is just beginning. A deployed model isn't a static artifact; it's a living system that's constantly interacting with a messy, ever-changing world. Without keeping a close eye on it, its performance will absolutely degrade over time.
This isn’t just a what-if scenario. It’s a massive operational roadblock for countless teams. Around 74% of organizations admit they struggle to scale their AI projects, and a huge reason is the lack of solid post-deployment monitoring. Fragile pipelines and a "deploy and forget" mindset are why a shocking 90% of models never even make it past the pilot stage.
To keep your model healthy, you need to watch it from three key angles: system health, data integrity, and real-world performance.
Tracking Operational Health
First things first, you have to make sure the lights are on. Is your model's serving infrastructure actually running? This is standard-issue software engineering, but it's mission-critical for MLOps. The goal is to track the core metrics that tell you if your API endpoint is responsive and reliable.
You should be logging and visualizing these system vitals:
- Latency: How long does it take to get a prediction back? A practical example is setting an alert that fires if the 99th percentile latency exceeds 500ms.
- Error Rate: Are requests failing? You need to be watching HTTP status codes like a hawk. For example, you should have a dashboard tracking the count of
500 Internal Server Errorresponses per minute. - Throughput (RPS): How many requests per second is your model handling? Understanding traffic patterns helps you scale your infrastructure to meet demand without burning cash.
The industry-standard toolkit here is Prometheus for scraping time-series data and Grafana for building dashboards. A real-world setup might involve a Grafana dashboard that visualizes 95th percentile latency and automatically pings your team on Slack if it creeps over a 200ms threshold for more than five minutes.
Detecting Data and Concept Drift
This is where model monitoring gets really specific to machine learning. Your model was trained on a snapshot of data from the past. It operates on the fundamental assumption that future data will look pretty much the same. When that assumption breaks, your model's accuracy starts to silently erode.
This breakdown typically happens in two ways: data drift and concept drift.
Data drift is when the statistical properties of your input data change. Concept drift is when the relationship between the inputs and the output changes.
Let's use a housing price prediction model as an example. You'd see data drift if the average square footage of homes being listed suddenly shot up after a new luxury condo development opens. The inputs have changed. You'd see concept drift if a major change in interest rates fundamentally altered how square footage affects price—the inputs might look the same, but what they mean for the prediction has changed.
You can't catch these silent killers with basic operational monitoring. You need specialized tools like Evidently AI or NannyML that are built to compare the statistical distributions of your live production data against your training data. A practical setup would involve running a daily job that generates an Evidently AI report, which visually shows a drift score for each feature.
Triggering Model Retraining
All the monitoring in the world is useless if you don't act on the signals. When your tools detect significant drift or your performance metrics take a nosedive, that's your cue: the model is out of sync with reality and it's time to retrain.
Your retraining strategy shouldn't be a fire drill; it needs to be an automated, well-defined process. A solid approach usually looks something like this:
- Set Clear Thresholds: Define the exact triggers in your monitoring system. For example, "If the Jensen-Shannon distance for the
user_agefeature drifts by more than 0.2, fire a retraining alert." - Automate the Pipeline: That alert should automatically kick off a CI/CD pipeline. This pipeline grabs a fresh dataset (including recent production data), retrains the model, and puts it through all your validation and testing stages.
- Deploy a "Challenger": The new model doesn't just go straight to production. It gets deployed as a "challenger" in a shadow deployment, running alongside the current "champion" model to prove it performs better on live traffic before you make the switch.
Got Questions About ML Model Deployment?
As you start moving models into production, you're going to run into some common questions. The world of machine learning model deployment is its own special kind of beast, full of jargon and trade-offs that can feel a bit overwhelming at first.
Let's clear up some of the most frequent ones we hear.
What's the Real Difference Between Model Deployment and Model Serving?
It’s super common for people to use these terms interchangeably, but they’re actually two distinct pieces of the puzzle.
Think of model deployment as the entire journey of getting your trained model from your laptop to a live environment. It’s the whole pipeline: packaging the model files, containerizing the application, setting up CI/CD to run tests, and finally pushing it all onto a production server. It’s the process.
Model serving, on the other hand, is the final piece—the operational component that’s actually running in production. It’s the specific software that loads your model and exposes an API endpoint to handle live prediction requests. A tool like FastAPI or TensorFlow Serving is your model server; the CI/CD pipeline that got it there is the deployment process.
Deployment is the "how it gets there" pipeline. Serving is the "what it does when it's there" part that talks to the outside world.
Should I Use a Cloud Platform or Build Everything on Kubernetes?
This is the classic "build vs. buy" debate, and honestly, the right answer really boils down to your team's skills and what you're trying to achieve long-term.
Managed cloud platforms like AWS SageMaker, Google Vertex AI, or Azure Machine Learning are fantastic for getting off the ground quickly. They handle all the messy infrastructure for you and come with a suite of integrated MLOps tools right out of the box. For example, deploying on Vertex AI might involve a few clicks in the UI and a simple gcloud command, getting you an endpoint in under an hour. This path gets you to production faster but can lock you into a specific vendor and might feel a bit rigid if you have highly custom needs.
Going your own way with Kubernetes gives you the ultimate control and flexibility. You can fine-tune every single part of your stack and avoid getting stuck with one cloud provider. That freedom doesn't come for free, though. It demands serious DevOps and Kubernetes expertise to set up, manage, and scale. A practical example would be writing custom YAML files for Deployments, Services, and Horizontal Pod Autoscalers to manage your model serving pods. The initial lift is much heavier.
What Are the First Signs of Model Drift, and What Do I Do?
Model drift is sneaky. It rarely announces itself with a bang. Instead, you'll start to see a slow, creeping decline in your model's performance metrics. Maybe accuracy dips by a fraction of a percent this week, and a little more the next. For a fraud model, this could manifest as a rising number of false negatives (missed fraud) that you only catch through manual review.
Another big clue is a statistical shift in the data you're feeding it. For example, if the average transaction amount for your fraud model suddenly increases by 20% due to a new popular product, that's a major red flag that the input distribution has drifted.
The only effective response is a proactive one. Your monitoring system needs to have clear thresholds that automatically trigger an alert when these subtle changes start happening.
Once that alert goes off, the playbook is usually pretty standard:
- Investigate: Is this real-world drift, or did a bug in an upstream data pipeline start sending garbage?
- Retrain: Kick off an automated pipeline to retrain the model on a fresh dataset, including the most recent production data.
- Validate and Redeploy: Before you push anything live, test the newly trained model against your current one to make sure it's actually an improvement.
What Is a Shadow Deployment and When Is It a Good Idea?
A shadow deployment is one of the most powerful, low-risk testing strategies you can use. You deploy a new "challenger" model into production right next to your current "champion" model.
The new model gets a copy of the exact same live production traffic, but its predictions are just logged. They are never sent back to the user or used for any real decisions. For example, if your current model predicts a loan application is "Approved," the shadow model might predict "Denied." Both results are logged, but only the "Approved" decision is shown to the user.
This lets you compare the two models' performance on real-world data without any risk to your users. You can analyze everything—latency, error rates, prediction outputs—and be 100% confident the new model is better before you flip the switch.
You should absolutely use a shadow deployment for any business-critical model or whenever you're making major architectural changes. It's the ultimate safety net.
At FindMCPServers, we're building a hub for developers to discover the tools and servers needed to connect their models to the real world. Explore our platform to find the right components for your next AI project. Learn more at https://www.findmcpservers.com.