You've poured months into building, training, and validating a new machine learning model. It graduates from the lab with flying colors, showing off impressive accuracy and predictive power. You push it into production, and for a while, everything is great.
But then, something strange starts to happen. Its brilliant performance begins to fade, and it starts making questionable—and costly—mistakes. What went wrong?
This frustrating scenario isn't usually a sign of a poorly built model. It's an inevitable reality we call model decay.
Why Your AI Models Silently Fail in Production

Think of your newly deployed model as a perfectly tuned race car designed for a specific, pristine track—that’s your training data. The moment it hits the real world, it encounters a whole new set of conditions: unexpected weather, bumpy roads, and different driver behaviors.
Without a pit crew constantly monitoring its condition and making adjustments, its performance is guaranteed to degrade. That pit crew is your model monitoring system.
The Inevitable Problem of Model Decay
Model decay is what happens when a model's predictive power drops off as it encounters new, live data that looks different from the data it was trained on. This is one of the biggest challenges in maintaining AI systems in production.
As experts from Krasamo's research on ML monitoring pipelines point out, models constantly drift from their initial performance because of shifting input data or subtle differences between the training and live environments. This is precisely why you need continuous monitoring pipelines running alongside your model—to catch these silent failures before they cause real damage.
"A deployed model is not a finished product; it's the beginning of a new process. Without monitoring, you're flying blind and assuming the world today is exactly the same as it was yesterday."
This problem can pop up in all sorts of ways, often silently chipping away at your business operations until the damage is too big to ignore.
Practical Examples of Silent Failures
To see how this plays out in the real world, just look at these common scenarios:
-
E-commerce Recommendations: Imagine a recommendation engine trained on pre-holiday shopping data. Once the holidays are over, customer behavior shifts dramatically to sales and returns. The model, stuck in the past, starts suggesting irrelevant products, causing user engagement and sales to plummet.
-
Financial Fraud Detection: A fraud model that was flawless on historical data suddenly starts missing new, sophisticated scam techniques that weren't in its training set. This silent failure can quickly lead to millions of dollars in undetected fraudulent transactions.
-
Healthcare Diagnostics: A model trained to identify diseases from medical images can lose accuracy when a hospital adopts newer imaging equipment with different resolutions. The model's performance degrades, potentially leading to dangerous misdiagnoses.
In every case, the model doesn't crash or throw an error. It just becomes quietly, and progressively, wrong.
This is why a robust machine learning model monitoring strategy isn't just a "best practice"—it's a fundamental requirement for any organization that relies on AI. It’s the essential pit crew that keeps your models running at peak performance, no matter what the real world throws at them.
Understanding Model Drift: The Silent Killer of Accuracy
A machine learning model is really just a snapshot in time. It's trained on data that captures a specific moment, a particular reality. But here's the catch: reality never stands still. This constant state of flux is what leads to model drift, the quiet, creeping decay of your model's performance. It’s the main reason a model that was once a star performer slowly starts making bad calls.
Model drift isn't just one problem; it's a family of related issues. The two most important members of that family are data drift and concept drift. Getting a handle on the difference between them is the first step to properly monitoring your models in the wild.
The infographic below shows some high-level metrics you should be watching, like accuracy, latency, and throughput. These are often the first canaries in the coal mine, signaling that something is amiss.
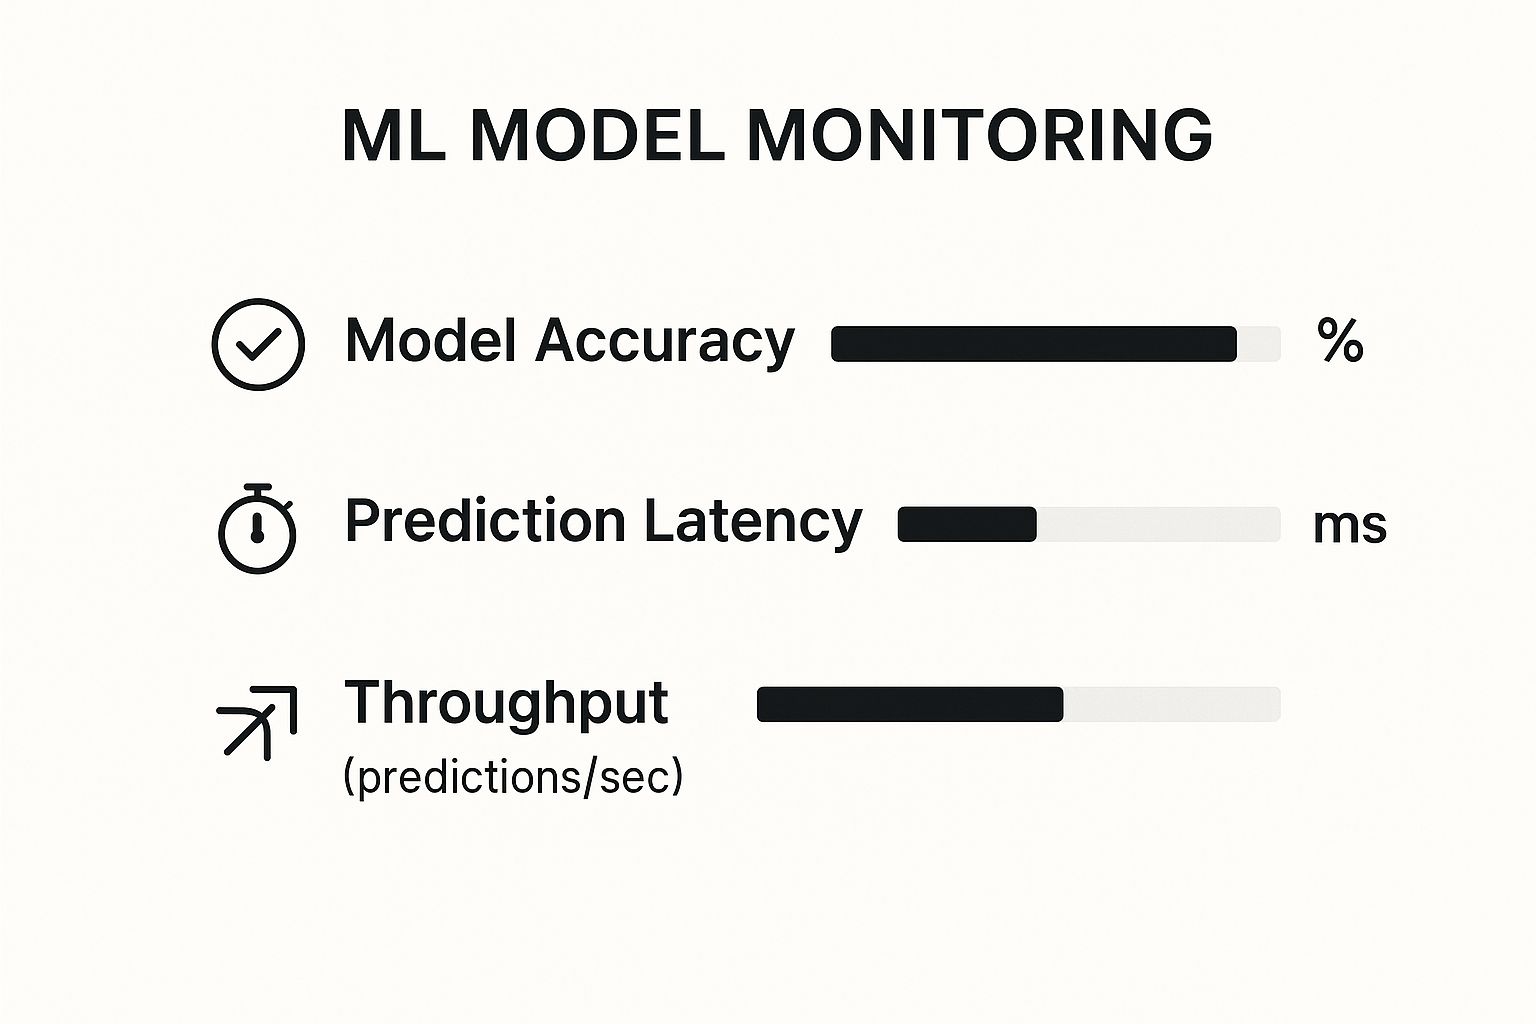
Keeping a close eye on these KPIs is vital. A sudden nosedive in accuracy or a spike in latency can be a clear sign that your model is struggling with new, unfamiliar data patterns.
What Is Data Drift?
Data drift, sometimes called covariate shift, is what happens when the statistical DNA of your input data changes, even if the underlying relationships stay the same. In simple terms, what your model is seeing changes, but the why hasn't.
Think about an e-commerce model built to predict sales during the summer. It's been trained on data packed with sandals, swimwear, and sunscreen. Then winter hits. Suddenly, the input data is all about coats, boots, and scarves. The model has never seen these patterns before, and its accuracy will almost certainly tank.
This is a textbook case of data drift. The core relationship between "items" and "sales" is unchanged, but the specific items themselves are completely different. This kind of drift is usually triggered by things like:
- Seasonality: A loan application model sees a surge in applications with lower average incomes after a major economic downturn.
- New User Segments: A food delivery app expands to a new city where the most popular cuisine is completely different from its original market.
- Upstream Data Changes: A sensor on a factory machine is replaced with a newer model that measures temperature in Celsius instead of Fahrenheit, corrupting the input data.
What Is Concept Drift?
Concept drift is a trickier, more subtle beast. This is when the very meaning of what you're trying to predict actually changes. The fundamental relationship between your input data and the target variable has shifted right under your feet.
A classic example is a spam filter. Years ago, it was trained to spot spam by looking for phrases like "FREE MONEY!!!" or lots of misspelled words. But scammers got smarter. Today's spam often looks like a legitimate password reset email or a fake shipping notification from a trusted brand.
The very definition of "spam" has evolved. The model's original understanding of the concept is now obsolete. That's concept drift.
Both data drift and concept drift are huge threats to your model's reliability. They cause "silent failures," where models start spitting out confidently wrong predictions without raising any obvious error flags. It's one of the biggest challenges in keeping models healthy once they're in production.
To make this distinction crystal clear, let's break down the key differences between these two types of drift.
Data Drift vs Concept Drift Explained
| Aspect | Data Drift | Concept Drift |
|---|---|---|
| What Changes | The distribution of the input data (the "X" variables). | The relationship between input data and the target variable (the "Y" variable). |
| Analogy | The types of cars on the road change from sedans to SUVs, but the rules of driving remain the same. | The meaning of a "red light" changes from "stop" to "stop unless turning right." The cars are the same, but the rules have changed. |
| Example | A loan approval model starts receiving applications from a younger demographic than it was trained on. | A fraud detection model's definition of "fraudulent" becomes outdated as criminals invent new scamming techniques. |
| Core Problem | The model sees data it wasn't trained on. | The model's "worldview" is no longer correct. |
| How to Fix | Often requires retraining the model on a new, more representative dataset. | Requires relabeling data and completely retraining the model to learn the new concept. |
Understanding this table is key. Are you dealing with new kinds of inputs, or has the very definition of your goal changed? Answering that question points you toward the right solution.
The Hidden Danger of Training-Serving Skew
There's one more critical issue that often gets lumped in with drift: training-serving skew. This happens when there's a mismatch between the data used for training and the data your model sees live in production.
This isn't about the real world changing; it's about your own internal processes being inconsistent. For instance, maybe your training pipeline fills in missing values with the average, but your live inference pipeline just uses a zero. That small difference creates a "skew" that can poison your model's performance, even if nothing out in the world has drifted.
Properly managing these data pipelines is a big deal, and it can be influenced by your whole system architecture, including the core components of an MCP server that might be handling data requests.
Without solid monitoring, these silent killers—data drift, concept drift, and training-serving skew—will chew away at your model's accuracy and business value. Catching them early isn't just a best practice; it's a matter of survival.
The Three Pillars of Effective ML Monitoring
A solid machine learning monitoring strategy isn't about staring at a single dashboard. It’s a complete framework built on three pillars that, when combined, give you a true 360-degree view of your model's health. If you neglect one, you're flying with a massive blind spot.

Think of it like the gauges in an airplane cockpit. One tells you your altitude (performance), another checks the fuel quality (data integrity), and a third warns of changing weather patterns ahead (drift). You need all three to fly safely.
Pillar 1: Model Performance
This is the big one. It answers the most fundamental question: "Is my model actually doing its job?"
Model performance monitoring is all about outcome-based metrics. You're measuring how well the model’s predictions stack up against real-world results, or what we call "ground truth." It’s the model’s report card, plain and simple.
You're tracking tangible metrics like accuracy, precision, recall, or F1-score to see if its grades are slipping. This is where you draw a straight line from model behavior to business value.
Practical Example: Fraud Detection Model Imagine a model built to flag sketchy credit card transactions. Its key performance metric might be the F1-score, which finds the sweet spot between catching real fraud (recall) and not bugging legitimate customers with false alarms (precision). If that F1-score starts to dip, you have a direct signal that the model is losing its edge and costing the business money.
Performance metrics are your bottom line. They are the ultimate verdict on whether your model is delivering value or creating problems. All other monitoring efforts exist to protect these core outcomes.
This direct link to ground truth is exactly why a structured approach to model management is so critical. For instance, the system outlined in the Model Context Protocol guide helps ensure data pipelines can consistently feed the model the real-world data it needs for this kind of evaluation.
Pillar 2: Data Integrity
Okay, so performance metrics tell you if something is wrong. Data integrity monitoring helps you figure out why.
This pillar is your system's health check. It makes sure the data flowing into your model is clean, consistent, and structured exactly as expected. It’s all about catching problems before they have a chance to poison your model’s predictions. The old saying "garbage in, garbage out" isn't a cliché in MLOps—it's a fundamental law.
Data integrity monitoring scans for issues like:
- Schema Changes: A feature column suddenly gets renamed, or its data type flips from a number to a string.
- Missing Values: You see an unexpected spike in nulls or empty fields for a feature that's supposed to always be there.
- Range Violations: A sensor that should report values between 0 and 100 suddenly starts spitting out negative numbers.
Practical Example: Predictive Maintenance Model A model predicts when factory equipment will fail based on sensor data like temperature and vibration. If an upstream data pipeline bug starts sending temperature data in Celsius instead of the expected Fahrenheit, the model's predictions will go haywire. Monitoring the range and distribution of that temperature data would catch this integrity issue instantly.
Pillar 3: Drift Detection
This is your early-warning system. Drift is the most proactive pillar, designed to spot subtle shifts in data patterns before they cause a nosedive in model performance. It’s your heads-up that the world is changing and your model might soon be out of date.
As we've discussed, this comes in two main flavors: data drift and concept drift. By keeping an eye on the statistical distributions of both your input features and the model's predictions, you can spot these changes as they happen.
Practical Example: Customer Churn Prediction A telecom company uses a model to predict which customers are likely to ditch their service. The model was trained when the main reason people left was bad call quality. But then a competitor launches a slick marketing campaign with way lower prices.
Suddenly, customer behavior shifts. Drift detection would flag that the statistical profile of the "monthly bill amount" feature for churning customers is changing. This signals that price is becoming a much bigger factor, giving the team a chance to retrain the model on this new reality before its accuracy plummets.
By systematically implementing all three pillars—Model Performance, Data Integrity, and Drift Detection—you build a truly resilient monitoring framework. This approach shifts you from a reactive state of frantically fixing failures to a proactive one of preventing them in the first place.
Choosing the Right Metrics to Track
So, you're set up to monitor your model. Now comes the big question: what should you actually be watching?
Think of it like being a doctor. You wouldn't just check a patient's temperature and call it a day. You need a full panel of vital signs to understand their overall health. Picking the right metrics for your model is the exact same idea—you need a mix of signals to get the complete picture. This is where a good machine learning model monitoring strategy really comes to life.
Your metrics will generally fall into two buckets: those that tell you how well your model is doing its job right now (performance) and those that act as an early warning system (drift).
Core Performance Metrics for Your Models
Performance metrics are your bottom line. They tie directly back to business value and tell you, in no uncertain terms, whether your model is actually working. The right ones depend completely on what you built the model to do.
For Classification Models (e.g., fraud detection, spam filtering):
- Accuracy: This is the most basic one—what percentage of predictions were correct? It's a decent starting point, but be careful. A fraud model that's 99% accurate might sound great, but it's useless if it never catches the 1% of cases that are actual fraud.
- Precision: When your model predicts something is positive (like flagging a transaction as fraud), how often is it right? High precision is critical when a false positive is costly. You don't want to constantly block legitimate customer purchases.
- Recall (or Sensitivity): Out of all the actual positive cases out there, how many did your model find? High recall is non-negotiable when a false negative is a disaster, like failing to spot a cancerous tumor in a medical scan.
For Regression Models (e.g., sales forecasting, price prediction):
- Mean Absolute Error (MAE): This gives you the average error of your predictions in the same units you're trying to predict. If you're forecasting sales in dollars, your MAE is also in dollars. It's simple, honest, and easy to explain.
- Root Mean Squared Error (RMSE): Similar to MAE, but it penalizes big mistakes more heavily. If one or two wildly inaccurate predictions can cause major problems, RMSE is your friend because it will scream much louder when those big errors happen.
Statistical Metrics for Drift Detection
While performance metrics tell you if your model has already failed, drift metrics tell you if your model is about to fail. They're your early-warning system, catching subtle shifts in your data before they tank your results.
Imagine you have two photos of a crowd, taken a week apart. Are the ages and genders roughly the same? Is the crowd just as dense? Drift metrics ask these kinds of questions about your data.
"Drift detection isn’t about measuring if the model is right or wrong. It's about measuring change. It lets you get ahead of problems, spotting instability in the wild before your model’s performance takes a nosedive."
Two of the most common statistical tests for this are:
- Population Stability Index (PSI): This is a classic. It measures how much a specific feature's distribution has changed between two points in time—like comparing the data you trained on to the data coming in today.
- Kullback-Leibler (KL) Divergence: This one measures the "distance" between two probability distributions. It's a flexible way to quantify just how different today's data is from the data your model originally learned from.
By keeping an eye on these, you can spot data drift before it poisons your model's accuracy, giving you a heads-up that it might be time to retrain.
Essential Model Monitoring Metrics at a Glance
To bring it all together, here’s a quick-reference table summarizing the must-have metrics for your machine learning model monitoring toolkit.
| Metric Category | Metric Name | What It Measures | Typical Red Flag Threshold |
|---|---|---|---|
| Classification | Accuracy | Overall percentage of correct predictions. | A steady decline or sudden drop below the established baseline. |
| Classification | Precision | The accuracy of positive predictions. | A drop indicates an increase in false positives. |
| Classification | Recall | The ability to find all actual positive cases. | A drop indicates an increase in false negatives. |
| Regression | RMSE | The square root of the average squared errors. | A significant spike indicates large prediction errors are increasing. |
| Drift | PSI | The change in a variable's distribution over time. | A PSI value above 0.25 signals a major shift. |
| Drift | KL Divergence | The "distance" between two data distributions. | A consistently increasing value indicates growing divergence. |
This isn't an exhaustive list, but it's the core set of vitals that will give you a robust view of your model's health in production.
Putting Your Monitoring Strategy Into Action
Alright, let's move from theory to reality. This is where the real value of model monitoring gets unlocked. This isn't just about throwing up a few dashboards and calling it a day; it's about building a smart, automated process that acts as a guardian for your model's performance.
Let’s walk through the steps to build a proactive monitoring system that slots right into your MLOps lifecycle.

Step 1: Establish Your Baseline
Before you can spot anything weird, you have to define what "normal" actually looks like. This is your baseline—the performance benchmark you’ll measure everything against. Without a solid baseline, your monitoring system is flying blind.
The best place to get this baseline is from your validation or hold-out test dataset. You know, the same data you used to sign off on the model before it went live. By running this data through your monitoring tools, you create a statistical snapshot of how the model should perform and what its input features typically look like. This becomes your ground truth.
Step 2: Choose the Right Monitoring Cadence
Not every model needs a babysitter watching it every second. The frequency of your checks—your monitoring cadence—should match the model's business impact and how quickly its environment changes.
Over-monitoring is just expensive noise, but under-monitoring is how silent failures happen. Finding that sweet spot is everything.
Here’s a simple way to think about it:
- Real-Time Monitoring: This is non-negotiable for high-stakes, high-speed applications where one bad prediction causes immediate problems. A credit card fraud detection model is the classic example; it needs millisecond-level scrutiny.
- Batch Monitoring (Near Real-Time): For many models, checking in every hour or so is plenty. Think of a product recommendation engine. If suggestions are a little off for an hour, it’s not a five-alarm fire. A daily review will catch drift long before it hurts sales.
- Weekly or Monthly Monitoring: Some models work on a much longer timeline, like a quarterly sales forecast. For these, a weekly or even monthly check-up is perfectly fine to make sure they're still on track.
Step 3: Set Intelligent Alert Thresholds
An alert system that pings you every five minutes is worse than no system at all. It just creates alert fatigue, and soon enough, your team starts ignoring notifications, which defeats the whole purpose. The goal is to set smart thresholds that only go off when a real issue is probably brewing.
Start with your baseline data. A 10% drop in accuracy from your baseline is often a reasonable place to start for performance metrics. For drift, a Population Stability Index (PSI) value above 0.25 is a common industry flag that something has shifted enough to warrant a look.
Key Takeaway: Your thresholds shouldn't be set in stone. As you collect more production data, you have to revisit and fine-tune them. A good threshold is a balancing act between catching real problems early and not crying wolf over nothing.
For example, a sudden 20% jump in null values for a critical feature is a data integrity red flag that needs an immediate alert. But a tiny, gradual drift in a less important feature? That might just need a note in a weekly summary report. Customize your alerts based on severity.
This process helps your monitoring system become a trusted part of your workflow. And speaking of workflows, it’s also important to understand how your models talk to other tools. To see how models communicate with external systems, check out our deep dive on the Model Context Protocol in our detailed guide.
Step 4: Define Your Action Plan and Close the Loop
An alert is just noise if you don't have a clear plan for what to do next. The final, and most critical, step is to connect monitoring directly to action. This plan needs to be well-defined and, whenever possible, automated.
Your action plan should answer a few key questions:
- Who gets the page? Is it the on-call data scientist, the MLOps engineer, or a product manager?
- How do we investigate? Lay out the steps to diagnose the root cause. Is it data drift? A broken pipeline? Concept drift?
- What’s the fix? The remedy could be anything from a simple pipeline patch to a full model retrain.
- When do we retrain? Set clear triggers for this. For instance, if model accuracy dips below your threshold for three straight days, a retraining job should kick off automatically.
A structured response plan like this turns your monitoring from a passive dashboard into an active defense system. It completes the MLOps lifecycle and makes sure your models keep delivering value long after you deploy them.
Common Questions About Model Monitoring
When you start putting model monitoring into practice, a few questions always seem to come up. Getting these right is the key to building a monitoring system that actually works without driving your team crazy. Let's dig into the most common ones.
How Often Should I Monitor My Models?
There's no single right answer here. The ideal monitoring frequency depends completely on your model's job and how fast its data changes.
Think of it like setting the shutter speed on a camera. For a race car speeding down the track, you need a lightning-fast shutter. For a quiet landscape, a slower one works just fine. The same logic applies to your models, which usually leads to a choice between real-time and batch monitoring.
-
Real-Time Monitoring (Continuous): This is for your high-stakes, fast-moving applications where every second counts. Think of a high-frequency trading model or a system flagging fraudulent credit card transactions. These need to be checked constantly, with millisecond latency, because a single missed event can have immediate and serious financial consequences.
-
Batch Monitoring (Periodic): Most models live here. A model that forecasts sales for the next quarter doesn't need to be watched every second. Running checks daily or even weekly is plenty to catch drift long before it messes with strategic decisions. In the same way, a product recommendation engine can be monitored hourly or daily.
The trick is to match your monitoring cadence to the business impact and the data velocity. Over-monitoring is a recipe for high costs and alert fatigue, while under-monitoring leaves you wide open to silent failures.
What Is the Difference Between Monitoring and Observability?
This is a classic point of confusion, but a simple analogy clears it right up.
Imagine you're driving a car. Monitoring is your check-engine light. It’s a pre-set alarm designed to tell you when a known, specific problem pops up—like low oil or a misfiring cylinder. It answers the question, "Is the system I already know about broken?" It's reactive and built for known failure modes.
Observability, on the other hand, is like having a master mechanic with a full diagnostic toolkit riding shotgun. It's the ability to ask new questions about what's happening inside your system, on the fly, without needing to ship new code. It helps you figure out why the check-engine light came on, especially for problems you've never even thought of before.
Monitoring tells you that something is wrong. Observability helps you figure out what is wrong, even if it's a completely novel issue. In MLOps, true observability gives you the tools to explore your model's behavior from the inside out.
So while monitoring tracks specific, pre-defined metrics like accuracy or data drift, observability provides the rich, detailed data needed to debug the "unknown unknowns."
Should I Build My Own Monitoring Tool or Buy One?
Ah, the classic "build vs. buy" debate. It’s just as real in MLOps as anywhere else. The right call comes down to your team's size, expertise, budget, and how complex your ML systems are.
Let's break down the trade-offs.
Building a Custom Tool
- Pros: You get total control. Every feature, alert, and dashboard can be tailored perfectly to your workflow and infrastructure. If you have the engineering talent on hand, it can also be cheaper in the long run.
- Cons: This is a massive upfront investment of engineering time. And you don't just build it once; you have to maintain it, update it, and scale it forever. This can easily turn into a full-time job for several engineers, pulling them away from building actual models.
Buying a Commercial Tool
- Pros: You get up and running fast. A sophisticated monitoring platform can be live in days, not months. These tools come with expert support, ready-made statistical tests, and are kept up-to-date by a dedicated team.
- Cons: It comes with a price tag (licensing fees). You might also hit a wall if you have a really unusual use case that the tool wasn't designed for. Plus, you’re tied to the vendor's product roadmap.
For most teams, a hybrid approach is the sweet spot. Start with a commercial tool like Arize AI or Fiddler AI to get robust monitoring in place quickly. Then, build small, custom pieces only when you have a specific need that isn’t met. This lets you focus your valuable engineering hours on what matters most: building great models.
At FindMCPServers, we're focused on building the ecosystem that supports advanced AI communication and integration. Explore our platform to discover MCP servers that can connect your models to the tools and data they need to perform at their best. Visit our MCP server directory to learn more.