Using Visio for process mapping has long been the standard for anyone serious about visualizing, analyzing, and actually improving their business workflows. It’s the tool you reach for when you need to transform a messy, complex series of operational steps into a crystal-clear diagram that shines a light on bottlenecks and helps you make smarter decisions.
Why Visio Still Dominates Process Mapping
In a market flooded with slick, web-based diagramming apps, Microsoft Visio holds its ground as a true powerhouse for professional process mapping. This isn't just about legacy or brand recognition; its staying power is rooted in a robust feature set built for the real-world needs of businesses.
Unlike some of the lighter alternatives, Visio was built for depth and integration. The game-changer is its seamless connection to the rest of the Microsoft ecosystem. Imagine you’re mapping out a procurement process. Instead of just drawing static boxes, each shape in your Visio diagram can link directly to a line item in an Excel spreadsheet, pulling in supplier data or cost center codes. Suddenly, your diagram isn’t just a picture—it’s a dynamic dashboard.
Core Strengths for Professional Use
What really sets Visio apart is its arsenal of industry-standard toolsets available right out of the box. You're not just getting a handful of basic shapes; you're getting entire libraries designed for specific, professional methodologies.
- Standardized Stencils: Visio comes loaded with comprehensive shape libraries for standards like BPMN (Business Process Model and Notation) and UML (Unified Modeling Language). For example, when mapping a software development lifecycle, you can use the UML stencil to accurately represent actors, use cases, and system boundaries, ensuring the diagram is immediately understood by any developer.
- Live Data Integration: The ability to link diagrams to live data from sources like Excel, Access, or SQL Server is where Visio truly shines. For example, a map of a manufacturing floor can have shapes that display real-time production numbers for each machine, updating automatically as the data changes.
- Deep Customization: From creating custom stencils that match your company's branding to building complex data validation rules, Visio offers a degree of control that simpler tools just can't match. You could create a validation rule that flags any process step with a cost over $500, making budget overruns instantly visible.
A Tool Built for Clarity and Compliance
At the end of the day, people stick with Microsoft Visio because its features directly help achieve critical business goals—spotting bottlenecks, cutting out redundant steps, and ensuring regulatory compliance. The collaboration features are also solid, allowing teams to co-author diagrams and drop in comments in real time, which drastically speeds up the feedback loop= with stakeholders.
This is what makes Visio a vital asset for improving operational clarity and quality control. This kind of structured approach is fundamental to mapping out complex systems, a concept we explore further in our complete guide to Model Context Protocol (MCP).
Practical Takeaway: Don't think of Visio as just a drawing tool. It's an analytical platform. A process map for customer returns can be configured to visually flag any step that takes longer than 48 hours, pulling that timing data directly from a live SharePoint list. That's the kind of practical power that keeps it essential for serious business analysis.
Get Your Visio Workspace Ready for Action

Before you even think about dropping a single shape onto the canvas, take five minutes to set up your Visio workspace. Trust me, this small upfront investment will save you hours of headaches down the road. A well-prepared environment is the bedrock of a clear, effective process map.
This isn't just about making things look pretty; it's about building a workspace that helps you work faster and more consistently. Think of it like a chef prepping their station before the dinner rush. You wouldn't start dicing vegetables with a dull knife and scattered ingredients. The same logic applies here—a little prep work makes for a much smoother, more professional outcome.
Start with the Right Template
Your very first move is picking the right template. This is a crucial step because it pre-loads the specific stencils and tools you’ll need for the job. Visio has a ton of options, but for process mapping, a few are head and shoulders above the rest.
Let's say you're mapping a new employee onboarding process. This workflow will inevitably cross multiple= departments: HR, IT, and the hiring manager's team. For a scenario like this, the Cross-Functional Flowchart template is your best friend. It automatically creates swimlanes, which are basically visual containers that clearly show who's responsible for what and where handoffs occur.
On the other hand, if you're mapping a simpler, single-department task like "Submit an Expense Report," a Basic Flowchart is all you need. It gives you the essential shapes without the added complexity of swimlanes you don't need.
I see this all the time: people starting with a blank drawing for every single project. Using a specific template like BPMN 2.0 or Cross-Functional Flowchart not only saves time but also ensures your diagram follows established standards right from the get-go.
Customize Your Space for Speed
Once your template is open, it's time to fine-tune the environment. This is where you can really make Visio work for you, not against you.
One of the most powerful—and most overlooked—features is the Quick Access Toolbar. That's the small menu sitting at the very top of the Visio window. By right-clicking any command in the ribbon (like "Align Center" or "AutoConnect"), you can add it to this toolbar. This keeps your most-used tools one click away, so you're not constantly digging through tabs to find them.
Here are a few other quick tweaks I always make:
- Load Specific Stencils: If your map needs industry-standard symbols, like those for BPMN 2.0, you can pull them in from the "More Shapes" option. For example, if you're mapping an IT service desk workflow, you could load the ITIL stencil to use standardized shapes for incidents and problems.
- Set Page Properties: Before you start drawing, head to the "Design" tab to set your page size and orientation (portrait vs. landscape). This simple step prevents a world of pain later when you realize you have to resize and reformat half your diagram.
Nailing these prep steps means that when you actually start mapping the process, your brain can focus entirely on the workflow itself, not on fighting with the software. This initial investment pays for itself over and over in both efficiency and the quality of your final map.
Step-by-Step: Building Your First Process Map in Visio
Alright, let's move from theory to practice. You can read about process mapping all day, but the real lightbulb moments happen when you get your hands dirty and actually start building.
We're going to map out a classic, real-world workflow from scratch: a customer order fulfillment process. It's a perfect example because almost every business has some version of it, and it clearly shows how different teams have to work together.
Laying the Groundwork: Departments, Shapes, and Flow
Imagine a small e-commerce shop. When an order comes in, it has to pass through a few hands—Sales gets the order, the Warehouse team picks and packs it, and finally, Shipping gets it out the door. Our goal is to visualize this entire journey to see who owns what and, more importantly, where things might be getting stuck. This is where Visio becomes more than just a drawing tool; it becomes a business analysis powerhouse.
First things first, we need to create clear lanes of responsibility. This is what swimlanes are for.
In your Visio canvas, find the "Cross-Functional Flowchart Shapes" stencil and drag three swimlanes onto the page. Let's label them Sales, Warehouse, and Shipping. Just like that, you've built a structured foundation that assigns ownership to every single step we're about to add.
Now, let's get the ball rolling. Every process needs a starting point. In the Sales swimlane, grab an oval shape (the Terminator) and label it "Order Received."
From there, the first action is to make sure the order is valid. Drag a rectangle (a Process shape) next to the starting point and call it "Verify Payment & Inventory."
This is where you'll fall in love with Visio's AutoConnect feature. Hover over the "Order Received" shape, and you'll see small blue arrows pop up. Click the arrow pointing toward your new rectangle, and Visio will automatically add a connector line for you. It’s a huge time-saver that lets you map out the basic skeleton of your process in minutes.
The image below shows the fundamental shapes you'll use constantly.
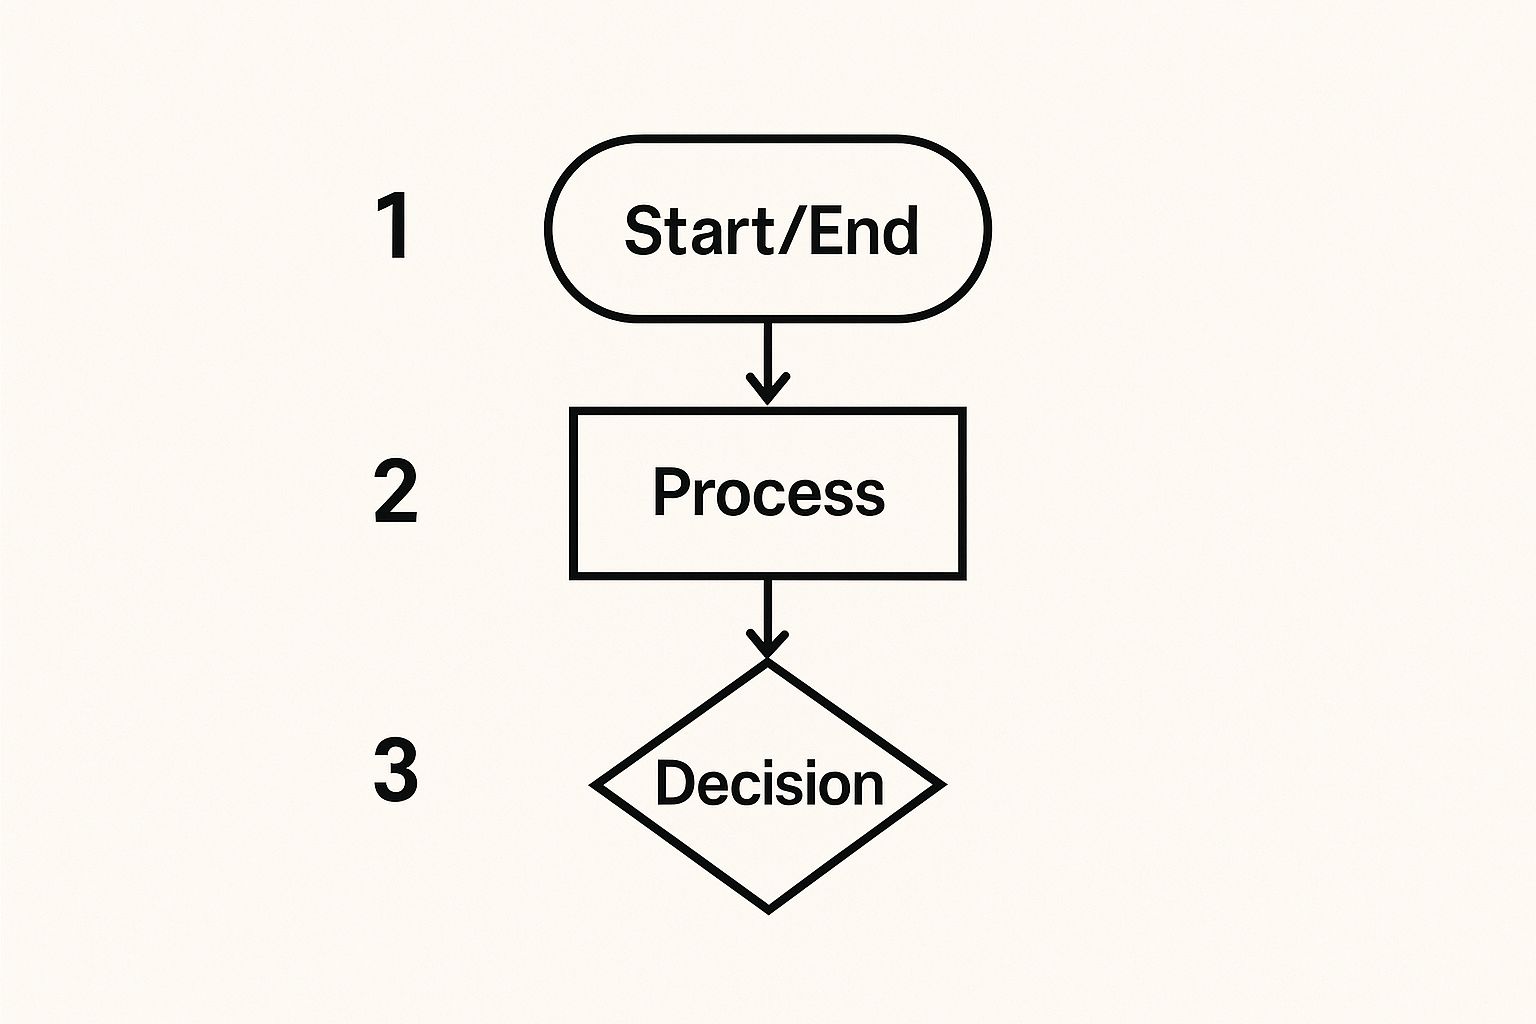
As you build more maps, you'll find that these shapes are the core vocabulary for just about any process you can think of. They provide a standardized, visual language that everyone can understand at a glance.
A quick reference guide can be super helpful when you're starting out. Here are the must-know shapes and what they represent.
Essential Visio Shapes for Process Mapping
| Shape Name | Visual | Meaning and Use Case |
|---|---|---|
| Terminator | Oval | The starting or ending point of a process. Every map should have at least one start and one end. Example: "Customer Submits Ticket." |
| Process | Rectangle | Represents a specific task or action. This is the most common shape you'll use. Example: "Pack Order." |
| Decision | Diamond | A point where the flow diverges based on a yes/no question. Always has at least two paths leading out of it. Example: "Is Request Approved?" |
| Subprocess | Rectangle with double lines | Indicates a predefined process that is detailed in a separate, more granular process map. Example: "Run Credit Check." |
| Data | Parallelogram | Shows inputs or outputs of a process. Example: "Customer Order Form." |
| Document | Wavy-bottom rectangle | Represents a specific document or report generated or used in the process. Example: "Packing Slip." |
Memorizing these will make your maps instantly readable to anyone familiar with standard flowcharting conventions.
After verifying the order, the process hits its first critical fork in the road. Drag a diamond shape (a Decision) into the flow and label it "Is Item in Stock?" A decision diamond will always have at least two exit paths—in this case, "Yes" and "No." If the answer is no, that path might lead to another process like "Notify Customer of Backorder." This keeps your map grounded in reality.
Adding Detail for a Professional Finish
With the basic flow in place, it’s time to add the details that make a process map truly valuable.
Assuming the item is in stock, the "Yes" path is where we see a handoff. The responsibility moves from the Sales team to the Warehouse team. The next step, "Pick and Pack Order," needs to be placed squarely inside the Warehouse swimlane to show this change of ownership. These handoffs are often where bottlenecks hide.
Pro Tip: If a single step like "Pick and Pack Order" involves several smaller tasks (find item, scan barcode, box it up), you can group them. Use a "Container" shape from the stencils to bundle these sub-steps together. This keeps your main diagram clean and high-level while still letting you capture the nitty-gritty details.
Finally, the packed order is handed off to the Shipping department. Here, we'll add the final two steps: "Generate Shipping Label" and "Ship Package."
To add another layer of utility, you can hyperlink shapes to other documents. For example, you can right-click the "Generate Shipping Label" shape, choose Hyperlink, and link it directly to your company's official shipping procedure document stored on SharePoint. Now your map isn't just a diagram; it's an interactive resource.
To tie it all together with a professional look, head over to the Design tab. You can apply a pre-built theme that instantly standardizes the colors, fonts, and connector styles across your entire map. In just a few clicks, it looks polished and ready for a presentation. This simple framework gives you everything you need to start mapping any business workflow you encounter.
Using Advanced Visio Techniques for Deeper Insights
 Once you've nailed down the basics of process mapping, you can start to unlock what makes Visio a truly formidable tool. The real magic happens when you transform your static diagrams into dynamic, data-rich dashboards that deliver genuine business intelligence. These advanced techniques are what separate a simple flowchart from a powerful analytical asset.
This is where your process map comes to life. Instead of just showing the sequence of steps, it starts answering the critical questions: "How long is this really taking?" or "Which part of the process is costing us the most?" By connecting your diagram to real-world data, you create a living document that mirrors the true state of your operations.
Linking Your Diagram to Live Data
The single most impactful feature in Visio, in my experience, is its ability to link shapes directly to external data sources. Imagine your process map for customer support tickets is hooked up to an Excel spreadsheet that tracks resolution times. As your team updates the spreadsheet, the diagram updates right along with it.
Let's take a manufacturing workflow as a practical example. You can link each "Process" shape on your map to a specific row in an Excel file that contains data points like cycle time, cost per unit, and error rate.
- First, set up an Excel sheet with clean, clear headers (e.g., "ProcessID," "StepName," "CycleTimeMinutes").
- Jump over to Visio, go to the Data tab, and click Quick Import.
- The wizard will walk you through connecting to your Excel file and linking the data rows to your shapes.
Suddenly, your diagram is no longer just a picture; it's a dashboard. This functionality is essential for anyone who needs to grasp the complex relationships between different system components, which shares a similar spirit with the concepts found in our breakdown of the Model Context Protocol.
Visualizing Metrics with Data Graphics
Linking data is powerful, but seeing that data directly on your map is a whole different level. This is where Data Graphics come in—they are visual elements like color-coded icons, progress bars, and text callouts that you can apply to shapes to represent the data underneath.
Going back to our manufacturing line, instead of just having the cycle time hidden= away in the shape's data properties, you could set up a data graphic to show a small clock icon next to any step that takes longer than 15 minutes.
By applying a simple rule, you make bottlenecks impossible to ignore. A red flag icon could automatically pop up on any process step where the error rate climbs above 5%, grabbing the immediate attention of anyone looking at the diagram.
Standardizing with Custom Stencils
Consistency is king when you're mapping processes across an entire department or company. If everyone is using slightly different shapes to mean the same thing, you're just creating confusion. Creating custom stencils is the solution here, and it's an absolute game-changer.
You can build a new stencil that contains only the company-approved shapes for process mapping, complete with pre-set colors and default data fields. For instance, a "New Project Request" shape could be pre-configured with fields for "Project ID," "Sponsor," and "Budget Code."
This not only enforces standardization but also saves your team a massive amount of time. The demand for content around these advanced practices is always growing, which really shows how central Visio is to workflow optimization. You can find tons of pros offering deep-dive tutorials on specialized diagrams, and if you want to see these methods in action, you can explore a detailed hour-long tutorial on advanced Visio techniques.
Sharing and Collaborating on Your Process Maps

A process map sitting on your hard drive is just a pretty picture. Its real power gets unlocked when your team can see it, challenge it, and build on it together. After all, the whole point of using Visio for process mapping is to create a shared understanding that actually drives improvement.
Luckily, Visio is built for the way modern teams work. Gone are the days of emailing static files back and forth, trying to track feedback from five different versions of the same document. That’s a recipe for confusion. Visio’s deep integration with the Microsoft 365 ecosystem makes sharing and co-authoring a refreshingly simple process.
Just save your diagram directly to a shared spot like SharePoint or OneDrive. Right away, you’ve created a single source of truth for the entire team.
Real-Time Feedback and Co-Authoring
Once your map lives in a shared environment, you can invite colleagues to view or edit it directly. This means multiple= people can be in the file at the same time, seeing each other's changes as they happen. It’s a game-changer for collaborative workshops.
For more targeted feedback, the built-in commenting feature is your best friend. Instead of sending a vague email, a project manager can drop a comment right on a specific "Decision" shape asking, "Does this approval step still require a manager's signature?" This kind of contextual feedback is vastly more efficient than trying to piece together a long email chain.
Key Insight: Treat your Visio file as a living document, especially during the review phase. By keeping all comments and edits within the file itself, you create a clear audit trail of decisions. This single step prevents the communication chaos that plagues old-school, email-based reviews.
Exporting Your Map for Different Audiences
Not everyone who needs to see your process map will have Visio installed, nor will they all need editing access. This is where knowing how to export your diagram in the right format becomes crucial for clear communication.
Think about who you’re sharing the map with and what they need to do with it. The format you pick can make a huge difference in how your hard work is received.
Here are a few practical scenarios I run into all the time:
- For a Formal Report: Exporting as a PDF is your best bet, hands down. It creates a professional, high-quality document that preserves all your formatting perfectly and can be opened by anyone on any device.
- For a PowerPoint Presentation: A high-resolution PNG image is ideal here. It will look crisp and clean on a slide, and it's easy to crop or resize without turning into a blurry mess.
- For a Company Wiki or Intranet: Saving the diagram as a Web Page (HTML) is a great option. This creates an interactive version that users can pan and zoom through right in their browser—perfect for navigating large, complex maps without overwhelming the viewer.
Choosing the right export format ensures your work is presented clearly and professionally, no matter who you're sharing it with.
Why Process Mapping Skills Are More Valuable Than Ever
Mastering a tool like Visio is a great start, but understanding why it’s so critical right now gives you a serious professional edge. The demand for clear, efficient workflows isn’t just a "nice-to-have" anymore—it’s a fundamental part of how modern businesses survive and grow.
Companies are constantly juggling digital transformation projects and ever-present regulatory compliance. This pressure is forcing them to document and sharpen every single process they have. Suddenly, process mapping has become one of the most vital skills for anyone in an operations, analytics, or management role. When you use Visio to map a process, you're not just drawing a diagram. You’re building the blueprint for a smarter, more resilient organization.
The Market Doesn't Lie
The numbers really drive this point home. The global market for Business Process Mapping Software, where Visio is a major force, was already valued at around $50 billion in 2023. It’s projected to climb to an impressive $82 billion by 2031.
That’s a massive investment from companies worldwide, and it confirms one thing: they are leaning heavily on process mapping to fix their operations and stay compliant. You can dig into the specifics with these market growth insights from Verified Market Research.
Investing your time in mastering a tool like Visio is a strategic career move. It positions you as a problem-solver who can bring clarity to complex systems, a skill that is always in high demand.
The real power here is in visualization. When you can map a process from end to end, you start seeing the bottlenecks and redundancies that are invisible in day-to-day work. For instance, a well-drawn map might reveal that a simple approval step is bouncing between three different departments, creating a hidden, week-long delay that no one had noticed.
This push for optimization is also getting a huge boost from automation. As businesses integrate smarter systems, a clear process map becomes the essential first step. Without it, you can't automate effectively.
If you’re interested in where this is all heading, our guide on powerful AI workflow automation tools is the perfect next read. At the end of the day, strong process mapping skills, backed by a powerful tool like Visio, are foundational for any meaningful business improvement.
Common Visio Process Mapping Questions
When you're in the thick of a project, the same few questions about Visio tend to come up again and again. Getting these sorted out ahead of time can save you a ton of headaches and keep things moving.
Does Visio Support BPMN 2.0?
A big one I always hear is about BPMN 2.0. The short answer? Absolutely, yes.
Visio comes equipped with specific templates and stencils designed to follow the BPMN 2.0 standard to the letter. This isn't just a nice-to-have; it ensures your diagrams are compliant, professional, and easily understood by anyone familiar with the notation. For example, you can accurately depict message flows between pools, timers for escalation events, and complex gateways—all critical for modeling sophisticated business processes correctly.
Visio Plan 1 vs. Plan 2: What's the Difference?
Another point of confusion is the difference between Visio Plan 1 and Plan 2. It's a critical distinction depending on what you need to do.
- Visio Plan 1: This is the web-based version. It's great for straightforward diagramming and collaboration on the fly. You could use it to quickly map out a simple vacation request process with your team.
- Visio Plan 2: This gives you the full-featured desktop application. For any kind of serious process analysis that involves data linking, advanced automation, or in-depth customization, Plan 2 is really the only way to go. This is the version you need for linking your floor plan to an asset inventory database.
How Do I Make My Diagrams Look Professional?
Finally, how do you give your process maps that polished, professional look? My go-to advice is to live in the "Design" tab.
Use it to apply consistent themes and color palettes across your entire diagram. It's also where you'll find alignment and distribution tools. A few clicks to perfectly align your shapes can take a map from looking cluttered and amateur to clean, organized, and easy to follow. A practical example is selecting a row of shapes and using "Align Middle" and "Distribute Horizontally" to create a perfectly spaced, professional-looking flow in seconds.
At FindMCPServers, we're focused on building the connections that power smarter AI. Explore our resources to see how the Model Context Protocol can streamline your development workflow at https://www.findmcpservers.com.