A slow or buggy application is a direct threat to your revenue and reputation. Users expect seamless performance, and any hiccup, from a lagging API call to an unhandled exception, can send them straight to a competitor. This is where Application Performance Monitoring (APM) becomes a non-negotiable part of your software development lifecycle. APM tools provide the deep visibility needed to identify, triage, and resolve issues before they impact your customers.
However, the market for application performance monitoring tools is crowded, with dozens of platforms offering seemingly similar features. Choosing the right one requires moving beyond marketing claims to understand which solution truly fits your specific technology stack, budget, and operational needs. For example, a platform excelling at Java monoliths might not be the best fit for a distributed system running on serverless functions and containerized microservices.
This guide cuts through the noise. We will provide a comprehensive breakdown of the 12 best APM solutions available today. For each tool, you will find:
- Practical Use Cases: Real-world scenarios where the tool excels.
- Feature Analysis: A deep dive into core capabilities like distributed tracing, code-level profiling, and real user monitoring (RUM).
- Honest Limitations: An assessment of potential drawbacks or implementation complexities.
- Screenshots & Direct Links: Visual references and easy access to each platform.
Our goal is to equip you with the detailed, practical information needed to select the APM tool that will help you build, run, and scale exceptional software. Whether you are a data scientist debugging a machine learning pipeline or a software engineer optimizing a customer-facing web app, this resource will help you find the right fit.
1. Datadog – Application Performance Monitoring
Datadog positions itself as a full-stack observability platform, but its strength as one of the leading application performance monitoring tools is undeniable. It excels at unifying traces, metrics, and logs into a single, cohesive view, which drastically reduces the mean time to resolution (MTTR) for complex issues in distributed systems. Its quick time-to-value is a significant differentiator; engineers can often get meaningful data within minutes of deploying the agent.
The platform’s real power lies in its correlation capabilities. For instance, when investigating a slow API endpoint, you can jump directly from a specific trace to the corresponding application logs and underlying host metrics (like CPU or memory) without switching contexts. A practical example: an SRE gets an alert for a 500-millisecond spike in the /api/v1/checkout endpoint. In Datadog, they can click on the slow trace, see that it’s caused by a database query, and then jump to the logs which show a "database connection timeout" error, all in one seamless workflow.
Key Features & Use Cases
- End-to-End Distributed Tracing: Visualize request flows across microservices with detailed flame graphs and service maps. For example, you can trace a user's click from a mobile app, through an API gateway, to a user authentication service, and finally to a database, identifying that the authentication service is adding 300ms of latency.
- Universal Service Monitoring: Utilizes eBPF technology to automatically discover services and their dependencies without requiring code instrumentation, ideal for environments with legacy services or limited code access.
- Continuous Profiler: An optional add-on that provides code-level insights, helping pinpoint inefficient functions. For example, the profiler might reveal that a specific
JSON.serialize()function is consuming 40% of the CPU time during a user profile update, pointing developers to the exact line of code to optimize. - Deployment Tracking: Correlate performance degradations directly with new code deployments, immediately highlighting problematic releases. For example, you can see that the error rate for your payment service jumped from 0.1% to 5% immediately after deploying version
v2.5.1.
Pricing and Practical Considerations
Datadog's pricing is unit-based and publicly available, which simplifies initial cost estimation. The APM is priced per host, with Pro and Enterprise tiers offering more features. However, costs can escalate quickly as your infrastructure grows or if you add features like the profiler or serverless monitoring. For a more detailed look, you can learn more about how to set up custom metrics in Datadog.
| Aspect | Details |
|---|---|
| Pros | Broad integration ecosystem, clear unit pricing, strong correlation of monitoring data. |
| Cons | Costs can become high with add-ons; host-based pricing can be complex for serverless. |
| Website | https://www.datadoghq.com/pricing/ |
2. New Relic – All-in-one Observability (includes APM)
New Relic offers a comprehensive, all-in-one observability platform where its application performance monitoring tools are a core component. The platform's main differentiator is its simplified, usage-based pricing model, which combines over 50 capabilities like APM, infrastructure, logs, and synthetics into a single offering. This approach eliminates the need to purchase and integrate multiple= separate tools, providing a unified experience from day one.
The platform is designed to lower the barrier to entry for observability with a generous free tier that includes 100 GB of data ingest per month. This allows small teams or individual developers to implement enterprise-grade monitoring without an initial investment. For example, a developer can monitor a side-project's API performance, set up alerts for slow database queries, and view logs all within the free plan, making it an excellent learning and development tool.
Key Features & Use Cases
- Unified Data Platform: All telemetry data (metrics, events, logs, traces) is stored in one place, enabling users to run complex queries with New Relic Query Language (NRQL). For example, you could run a query like
SELECT average(duration) FROM Transaction WHERE appName = 'billing-service' FACET user_planto see if premium users are experiencing faster response times than free users. - Full-Stack Observability: Seamlessly navigate from a slow mobile app interaction to the specific backend trace, corresponding infrastructure metrics, and the exact log lines causing the error.
- Applied Intelligence (AIOps): Automatically detects anomalies, correlates related incidents, and reduces alert noise. For example, instead of getting 20 separate alerts for a database failure, New Relic groups them into a single incident that identifies the slow database as the likely root cause impacting multiple= services.
- Generous Free Tier: Offers full platform access for one user with 100 GB of data ingest per month, perfect for startups, individual developers, and pre-production environments.
Pricing and Practical Considerations
New Relic’s pricing is primarily based on data ingest and the number of full-platform users, which offers predictability. The Standard, Pro, and Enterprise editions provide different levels of support, data retention, and security features like SSO. While the usage model is straightforward, accurately estimating your future data ingest volume can be challenging, which is a key factor in cost calculation. Advanced features can also increase the per-GB cost of data.
| Aspect | Details |
|---|---|
| Pros | Predictable usage model with easy free tier access, comprehensive feature coverage. |
| Cons | Cost estimation requires guessing data ingest volume; advanced features raise costs. |
| Website | https://newrelic.com/pricing |
3. Dynatrace – Unified Observability with APM
Dynatrace offers an all-in-one platform where its capabilities as one of the premier application performance monitoring tools are powered by extensive automation and a causal AI engine named Davis. It is designed to minimize manual configuration and triage. The platform's core strength is its OneAgent technology, which automatically instruments hosts and processes upon deployment, discovering dependencies and building a real-time topology map called Smartscape. This provides immediate, full-stack context without requiring engineers to manually define services or relationships.
The platform's standout feature is its AI-driven root-cause analysis. Instead of just presenting correlated data, Davis AI automatically analyzes billions of dependencies in real-time to pinpoint the precise root cause of a problem, significantly reducing alert noise and shortening resolution time. For example, if a user-facing service slows down, Davis can trace the issue back through multiple= microservices to a specific problematic database query or a recent code deployment, presenting it as a single, actionable problem like: "Root Cause: A recent deployment of the inventory-service introduced a new SQL query that is scanning the entire products table, causing high CPU on the database and slowing down all dependent services."
Key Features & Use Cases
- OneAgent & Smartscape: Provides fully automated instrumentation and continuous topology mapping for dynamic, cloud-native environments, including Kubernetes and microservices.
- Davis AI Engine: Delivers automatic and precise root-cause analysis, moving beyond correlation to identify causation for performance degradations, errors, and user experience issues.
- OpenTelemetry Ingestion: Natively ingests OpenTelemetry data, allowing teams to combine the platform’s automated instrumentation with custom, open-standards-based observability data.
- Unified Security and Performance: Integrates runtime application security directly into the APM, identifying vulnerabilities in production code. For example, it can flag a Log4Shell vulnerability in a running Java service and show which transactions are hitting the vulnerable code path.
Pricing and Practical Considerations
Dynatrace uses a transparent, consumption-based pricing model with a detailed public rate card for each capability, billed hourly. This contrasts with traditional host-based or high-watermark licensing, offering flexibility but requiring cost management. The platform's comprehensive, AI-driven nature can be a powerful asset for organizations looking to automate their observability practices. You can explore how similar AI concepts apply to monitoring machine learning models to understand the broader impact of such technologies.
| Aspect | Details |
|---|---|
| Pros | Highly automated deployment and root-cause analysis, clear rate-card pricing, strong out-of-the-box Kubernetes coverage. |
| Cons | Enterprise-grade feature set may be overwhelming for small teams; hourly metering can be unfamiliar to manage. |
| Website | https://www.dynatrace.com/pricing/ |
4. Cisco AppDynamics – APM and Business Transaction Monitoring
Cisco AppDynamics stands out among application performance monitoring tools by tightly coupling performance data with business outcomes. It excels in complex, large-scale enterprise environments, particularly those heavily reliant on Java and .NET applications. Instead of just tracking requests, AppDynamics organizes performance data around "Business Transactions," which are end-to-end user actions like "add to cart" or "process payment."
This business-centric approach allows teams to directly correlate application slowdowns with their impact on revenue or user experience. For example, an engineering lead can immediately see that a spike in database query latency for the "checkout" transaction is putting a specific dollar amount of revenue at risk. This context is invaluable for prioritizing fixes and communicating the impact of technical issues to business stakeholders. A practical dashboard might show that a 2-second slowdown in the "Confirm Purchase" transaction leads to a 10% drop in conversion rate, translating to an estimated $50,000 in lost revenue per hour.
Key Features & Use Cases
- Business Transaction–Centric APM: Automatically discovers and monitors key user journeys, providing a clear line of sight from code performance to business KPIs.
- Automatic Discovery and Mapping: Generates dynamic flow maps that visualize application dependencies in real time, simplifying troubleshooting in distributed architectures.
- Deep Code-Level Diagnostics: Offers detailed transaction snapshots and call graphs. For example, a snapshot can reveal that a "process payment" transaction is spending 90% of its time waiting for a response from an external payment gateway API, immediately identifying the root cause of a slowdown.
- Hybrid Environment Support: Provides robust monitoring for both on-premises data centers and multi-cloud environments, including optional modules for SAP and infrastructure monitoring.
Pricing and Practical Considerations
AppDynamics offers clear, publicly available pricing based on CPU-core units, with different editions (APM Pro, Enterprise) catering to specific needs. This model is well-suited for traditional server-based deployments but can be less intuitive for modern containerized or serverless workloads where CPU allocation is dynamic. The platform's cost can increase significantly as you add optional modules like application security or real user monitoring.
| Aspect | Details |
|---|---|
| Pros | Strong alignment with business KPIs, widely adopted in enterprise .NET/Java environments, clear edition packaging. |
| Cons | Per-CPU-core licensing is less intuitive for modern cloud architectures; add-ons increase total cost. |
| Website | https://www.appdynamics.com/pricing |
5. Splunk Observability Cloud – Splunk APM
Splunk is best known for its log management capabilities, but its Splunk APM extends these strengths into observability. As one of the more powerful application performance monitoring tools, its key differentiator is its no-sampling, full-fidelity tracing. This means it ingests 100% of trace data, which is invaluable for catching intermittent or rare errors that sampled-based systems might miss. Its real-time streaming analytics engine allows for near-instantaneous alerting and analysis of performance data.
The platform is particularly effective in high-throughput environments where data cardinality is a major challenge. When an alert fires for a latency spike, Splunk APM lets you analyze the complete dataset behind it, rather than just a representative sample. For example, if a single high-value customer is experiencing a rare checkout error that only happens 0.01% of the time, a no-sampling system like Splunk will capture every instance, allowing you to filter traces by that customer_id and debug their specific issue. Sampled systems might miss this error entirely.
Key Features & Use Cases
- Full-Fidelity Tracing: Ingests every transaction without sampling, ensuring you can analyze every error and outlier, which is ideal for compliance-heavy or high-stakes applications.
- Streaming Analytics: Enables sub-second alerting on metrics derived from traces. For example, you can set an alert to fire the instant the p99 latency for your login service exceeds 500ms over a 1-minute window, catching issues faster than traditional batch-processing systems.
- Service Maps and Business Workflows: Automatically discovers service dependencies and allows you to map them to critical business processes, showing the direct performance impact on user experience.
- OpenTelemetry Native: Built on OpenTelemetry, offering vendor-neutral instrumentation and seamless integration with a broad ecosystem of open-source tools.
Pricing and Practical Considerations
Splunk Observability Cloud’s pricing is primarily host-based for APM, with separate SKUs for Real User Monitoring (RUM) and Synthetics. While this à la carte model offers flexibility, it requires careful management to control costs. Organizations already invested in the Splunk ecosystem for logging will find the integration seamless and powerful, creating a unified analytics experience.
| Aspect | Details |
|---|---|
| Pros | Excellent for high-cardinality data, no-sampling architecture, fast alerting, strong Kubernetes support. |
| Cons | Host-based pricing may not be ideal for all workloads; separate SKUs can complicate cost management. |
| Website | https://www.splunk.com/en_us/products/pricing/observability.html |
6. Elastic Observability (Elastic APM)
Built on the powerful Elastic Stack (ELK), Elastic APM provides an open= and flexible solution among application performance monitoring tools. It stands out by being OpenTelemetry-native, allowing teams to ingest traces, metrics, and logs without vendor lock-in. This makes it an excellent choice for organizations that already leverage Elasticsearch for logging or search and want to expand into full-stack observability without adding an entirely new vendor.
The platform’s strength is its unified data model. For example, when a machine learning job detects an unusual spike in transaction latency, you can seamlessly pivot from the APM trace to the underlying application logs and infrastructure metrics within the same Kibana interface. A practical scenario: you see a slow transaction in the APM view, click to see related logs, and discover a NullPointerException log message that occurred at the exact same time, immediately identifying the root cause.
Key Features & Use Cases
- OpenTelemetry-First Ingestion: Natively supports OTel protocols for traces, metrics, and logs, offering maximum flexibility and preventing vendor lock-in with its auto-instrumentation agents.
- Unified Observability: Correlates APM traces with logs and infrastructure metrics in a single datastore, enabling powerful root cause analysis within one UI.
- Machine Learning & AIOps: Automatically detects anomalies, identifies regressions, and simplifies root cause analysis. For example, it can learn the normal response time for an API and automatically create an alert when it deviates significantly after a new deployment.
- Synthetic Monitoring: Optional add-ons allow for proactive monitoring of user experience. For instance, you can set up a browser test that logs into your application, adds an item to the cart, and proceeds to checkout every 5 minutes from different global locations to ensure the user journey is always functional.
Pricing and Practical Considerations
Elastic offers flexible pricing with both a hosted (Elastic Cloud) and a new serverless option, simplifying operations and billing. The model is resource-based, primarily focusing on data ingestion, storage, and retention. While this provides cost-effective scaling, it requires careful planning to manage data pipelines and retention policies, as costs can vary based on usage. Tuning the data model is often key to optimizing spend.
| Aspect | Details |
|---|---|
| Pros | Open and flexible platform, reuses existing Elastic Stack deployments, serverless option. |
| Cons | Pricing can be nuanced due to data variance; may require expertise to configure pipelines. |
| Website | https://www.elastic.co/products/apm |
7. Grafana Cloud – Application Observability (Traces/Profiles/RUM)
Grafana Cloud builds its observability suite on a foundation of popular open-source projects, offering one of the most flexible application performance monitoring tools for teams committed to open= standards. It integrates metrics (Prometheus), logs (Loki), traces (Tempo), and continuous profiling (Pyroscope) into a single, managed platform. This approach avoids vendor lock-in and appeals to engineers already familiar with the Grafana ecosystem.
The platform's key differentiator is its toolchain neutrality and composability. Instead of a proprietary agent, it leverages OpenTelemetry for instrumentation, allowing you to send data from virtually any source. For example, a development team can correlate a slow API transaction captured by Tempo with specific error logs from Loki and CPU profiles from Pyroscope, all within the same Grafana dashboard, providing a complete picture of an incident without leaving the interface.
Key Features & Use Cases
- Open-Source Core: Built around Prometheus, Loki, Tempo, and Mimir, providing a familiar and powerful experience for users of these tools.
- Application Observability Bundle: A simplified pricing SKU that bundles traces, metrics, logs, and profiles on a per-host-hour basis, making it easier to predict costs.
- Integrated Performance Testing: Includes Grafana k6 for running load tests and synthetic monitoring. A practical example is a developer writing a k6 script to simulate 1,000 users signing up simultaneously, then viewing the APM traces in Grafana to see how the backend services perform under that load.
- Generous Free Tier: Offers a substantial "Always Free" plan, making it highly accessible for small projects, startups, or for teams wanting to conduct a thorough evaluation.
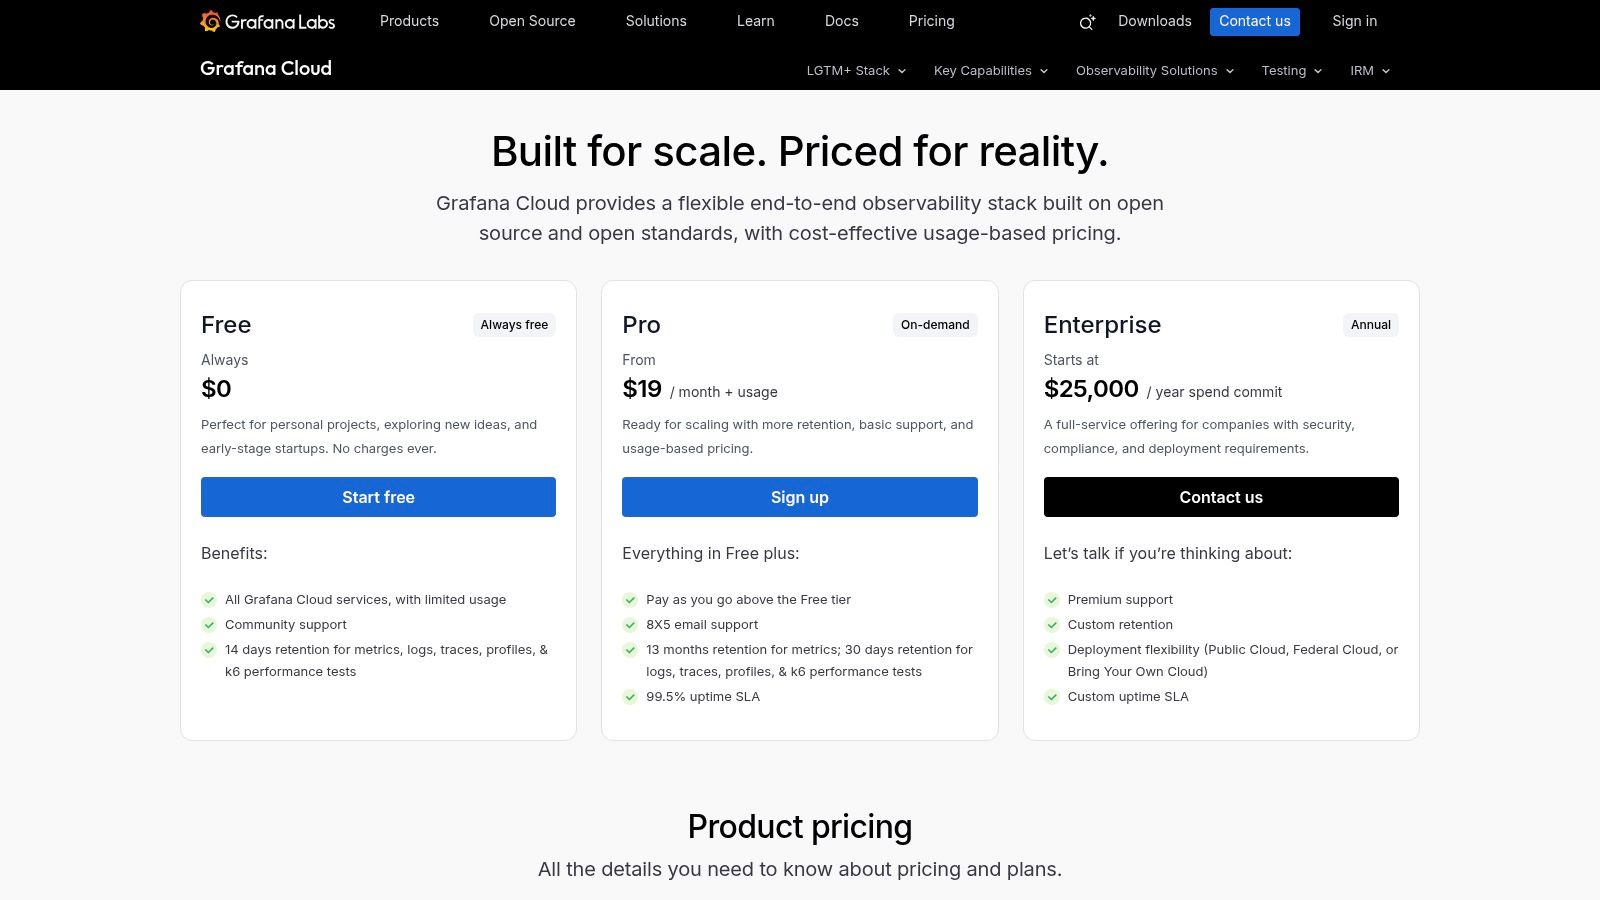
Pricing and Practical Considerations
Grafana Cloud’s pricing is usage-based and transparent, with separate meters for metrics, logs, traces, and other components. While this offers flexibility, managing the costs of multiple= metered services can be complex as usage grows. The Application Observability bundle simplifies this but is geared toward host-based deployments. For a deeper understanding, you can learn more about how to connect various Grafana data sources to build comprehensive dashboards.
| Aspect | Details |
|---|---|
| Pros | Strong adherence to open= standards (OpenTelemetry), transparent pay-as-you-go pricing, powerful and accessible free tier. |
| Cons | Pricing can be complex with multiple= metered components; some enterprise-grade plugins require separate licenses. |
| Website | https://grafana.com/pricing/ |
8. Sentry – Performance Monitoring (APM-style spans, profiling)
Sentry began as an error-tracking tool but has evolved into a robust performance monitoring platform that remains exceptionally developer-friendly. It stands out by connecting application errors directly to performance degradation, offering a cohesive workflow where an error alert can lead you straight to the slow transaction trace that caused it. This context-rich approach is what makes Sentry one of the most practical application performance monitoring tools for teams focused on shipping code quickly.
The platform is particularly strong in frontend and mobile application monitoring, providing vital metrics like Web Vitals, transaction traces, and session replays. For instance, a developer can watch a user's session replay to see exactly what they did before a "rage click" occurred, then pivot to the associated transaction trace to identify the slow database query or API call responsible for the poor experience. This direct link between user action and backend performance is incredibly powerful.
Key Features & Use Cases
- Integrated Error and Performance Monitoring: Automatically links errors to performance traces. For example, a JavaScript
TypeErrorin the browser can be linked directly to the trace for a slow API call that returned an unexpectednullvalue, showing both the cause and effect in one view. - Code-Level Profiling: Pinpoint inefficient functions and lines of code that are consuming the most CPU resources within a specific transaction, without the overhead of traditional profilers.
- Session Replay: Visually reproduce user sessions to understand frontend errors and performance issues from the user's perspective, ideal for debugging complex UI bugs.
- Cron Job & Uptime Monitoring: Monitor the performance and health of scheduled tasks and external-facing services. For example, you can get an alert if your nightly data-sync cron job takes longer than its 30-minute threshold or fails to run entirely.
Pricing and Practical Considerations
Sentry offers a generous free tier and a pay-as-you-go model that is event-based, making it highly accessible for startups and smaller teams. You pay for buckets of events (errors, transactions, replays) rather than per host, which is cost-effective for services with fluctuating workloads. However, this usage-based pricing requires careful monitoring to avoid unexpected costs. A self-hosted option is also available for organizations with strict data residency or compliance requirements.
| Aspect | Details |
|---|---|
| Pros | Developer-friendly instrumentation, competitive pay-as-you-go pricing, self-hosted option. |
| Cons | Less comprehensive for deep infrastructure monitoring; usage-based pricing requires budget management. |
| Website | https://docs.sentry.io/pricing/ |
9. Honeycomb – Observability with high-cardinality tracing
Honeycomb champions an event-based approach to observability, positioning itself as an essential tool for debugging complex, unpredictable production systems. Rather than focusing on pre-aggregated metrics, it ingests high-cardinality, wide-event data, making it one of the most powerful application performance monitoring tools for exploratory analysis. This allows engineering teams to ask new questions about their software's behavior without needing to define new metrics in advance.
The platform’s standout feature is its query engine, which is optimized for high-dimensional data. For instance, when an SLO alert triggers, you can use its "BubbleUp" feature to automatically compare attributes of failing requests against successful ones. A practical example: your API latency SLO is breached. You highlight the slow requests, and BubbleUp immediately shows that 95% of them have user_ids belonging to a single, large enterprise customer who is hitting a specific un-cached endpoint, a needle-in-a-haystack discovery that would be difficult with traditional metric-based tools.
Key Features & Use Cases
- High-Cardinality Distributed Tracing: Analyze traces with an unlimited number of custom attributes, perfect for understanding user-specific behavior or tracking feature flag rollouts.
- BubbleUp Differential Analysis: A powerful workflow that automatically surfaces the attributes that are most different between a baseline and a highlighted selection, drastically accelerating root cause discovery.
- Service Level Objectives (SLOs): Define, monitor, and alert on user-centric performance indicators, helping teams focus on what truly matters to the end-user experience.
- OpenTelemetry Native: Built with native support for OpenTelemetry, allowing for vendor-neutral instrumentation and easy integration with a broad ecosystem of libraries and frameworks.
Pricing and Practical Considerations
Honeycomb offers predictable, event-volume-based pricing tiers, with free and pro plans available alongside enterprise options. This model is advantageous as it includes unlimited users and services, simplifying cost management. However, accurately sizing your required= event volume requires some upfront planning and analysis. Features like frontend monitoring (RUM) are available as add-ons, which can increase the overall cost.
| Aspect | Details |
|---|---|
| Pros | Very fast exploratory debugging suited for microservices, predictable event-based pricing. |
| Cons | Sizing event volume requires upfront planning; narrower scope than all-in-one suites. |
| Website | https://www.honeycomb.io/pricing/ |
10. IBM Instana Observability – APM and full-stack
IBM Instana Observability stands out in the crowded field of application performance monitoring tools with its emphasis on complete automation and real-time context. The platform is engineered to automatically discover and map all services, dependencies, and infrastructure components, providing a dynamic graph of your entire application landscape. Its 1-second metric granularity and end-to-end tracing provide an exceptionally detailed view, ideal for identifying transient issues in highly dynamic environments like Kubernetes.
Instana's core value proposition is its ability to correlate every trace with the underlying infrastructure and contextualize it without manual configuration. For example, if a specific service call in a trace is slow, Instana immediately links it to events on the host or container, such as a noisy neighbor process or a recent Kubernetes pod restart. In practice, this means an alert for a slow API call will come with context like "This slowdown coincides with a Kubernetes pod eviction event on node kube-worker-3," immediately guiding the engineer to the infrastructure-level cause.
Key Features & Use Cases
- Automatic Service Discovery: Instana's agent automatically identifies all components of an application stack, including microservices and serverless functions, and builds a real-time dependency map.
- End-to-End Distributed Tracing: Captures and analyzes 100% of requests with 1-second granularity, ensuring no transaction is missed, which is critical for debugging intermittent failures.
- Kubernetes and Container Monitoring: Provides deep visibility into containerized applications, monitoring pod health, resource allocation, and orchestrator events within the same context as application traces.
- Optional Synthetics and 'Logs in Context': Flexible add-ons allow you to expand observability with proactive monitoring and seamlessly connect traces to relevant log messages without overhauling your entire logging solution.
Pricing and Practical Considerations
Instana’s pricing is based on Managed Virtual Server (MVS) units, a model designed to simplify billing across diverse environments by abstracting hosts, containers, and serverless functions into a single metric. The platform offers the same powerful feature set for both its SaaS and self-hosted versions, and all plans include unlimited users. While the MVS concept aims for predictability, it can require some initial effort to understand and forecast.
| Aspect | Details |
|---|---|
| Pros | Unlimited users with predictable per-MVS unit pricing, Paralleled feature set for SaaS and self-hosted deployments, Flexible add-ons for logs and synthetic monitoring. |
| Cons | New concept of MVS units adds complexity to pricing, Add-on metering requires active management. |
| Website | https://www.ibm.com/products/instana/pricing |
11. Azure Monitor – Application Insights (Microsoft Azure)
For organizations deeply invested in the Microsoft ecosystem, Azure Monitor’s Application Insights is a powerhouse among application performance monitoring tools. Its primary advantage is its seamless, native integration with Azure services. This allows it to automatically discover and map dependencies between Azure App Services, Functions, and other resources, providing immediate context without extensive configuration.
The platform's true differentiator is its powerful analytics engine, Log Analytics, which uses the Kusto Query Language (KQL). This gives engineers the ability to run incredibly detailed, ad-hoc queries against telemetry data. For example, you could write a KQL query to find all failed requests for a specific user that originated from a certain geographic region within the last hour, offering a level of investigative depth that many competitors struggle to match. A practical query might look like: requests | where success == false and client_CountryOrRegion == "Brazil" | summarize count() by user_Id.
Key Features & Use Cases
- Distributed Tracing and Application Map: Automatically visualizes component interactions, helping identify performance bottlenecks in multi-service architectures hosted on Azure.
- Availability Testing: Configure standard ping tests or complex multi-step web tests. For example, you can create a test that simulates a user logging in, adding an item to their cart, and clicking checkout, running every 5 minutes from a datacenter in Europe to ensure availability for that market.
- Powerful KQL Analytics: Go beyond pre-built dashboards to perform deep diagnostic queries on logs, metrics, and traces to uncover root causes of complex issues.
- OpenTelemetry-Based Instrumentation: Supports modern, vendor-agnostic instrumentation, allowing for monitoring of applications regardless of where they are hosted, though it works best with Azure.
Pricing and Practical Considerations
Azure Monitor’s pricing is famously complex, operating on a pay-as-you-go model based on data ingestion, retention, web tests, and alerting rules. While this offers flexibility, it can be difficult to forecast costs accurately. The tool delivers its highest value when used for applications running on Azure, as the integrations are tighter and billing is consolidated, simplifying financial management for existing Azure customers.
| Aspect | Details |
|---|---|
| Pros | Native integration with Azure and consolidated billing, robust KQL for deep diagnostic queries. |
| Cons | Complex pricing matrix; optimal value is best realized when workloads are hosted on Azure. |
| Website | https://azure.microsoft.com/pricing/details/monitor/ |
12. AWS Marketplace – Observability & APM solutions hub
Rather than a single product, the AWS Marketplace serves as a centralized hub for discovering, purchasing, and deploying a wide array of third-party application performance monitoring tools. Its primary value proposition is streamlining procurement and billing for organizations heavily invested in the AWS ecosystem. Instead of managing multiple= vendor contracts, teams can subscribe to leading APM solutions directly through their AWS account, consolidating all charges into a single bill.
This model simplifies the trial and adoption process significantly. For instance, a developer can find a tool like New Relic or Splunk, subscribe with one click, and often deploy it using pre-configured AWS CloudFormation templates. This tight integration is ideal for teams needing to quickly evaluate and implement monitoring for their AWS-native workloads without lengthy procurement cycles. A practical example: a team needs to monitor a new service running on Amazon EKS. They can go to the AWS Marketplace, subscribe to Datadog, and use the official Datadog Operator for Kubernetes to deploy the agent to their cluster in under an hour, with all billing handled through their existing AWS account.
Key Features & Use Cases
- Centralized Procurement: Discover, try, and buy multiple= APM tools (like Datadog, Dynatrace, etc.) with billing integrated directly into your AWS invoice.
- One-Click Deployment: Many listings offer simplified deployment using AWS CloudFormation or Amazon Machine Images (AMIs), reducing setup complexity.
- Private Offers & Governance: Enterprises can negotiate custom pricing and terms directly with vendors through the Marketplace, maintaining procurement controls.
- Solution Curation: Provides curated lists of tools organized by industry (e.g., financial services) or use case (e.g., container monitoring), helping teams find relevant solutions.
Pricing and Practical Considerations
Pricing is vendor-specific and varies widely, but the key benefit is that costs are consolidated within your AWS bill. This can also help organizations meet their AWS Enterprise Discount Program (EDP) spending commitments. The main practical consideration is that the experience is optimized for AWS environments; deploying these solutions to on-premise or multi-cloud infrastructures might be less straightforward than buying directly from the vendor.
| Aspect | Details |
|---|---|
| Pros | Simplifies procurement with consolidated AWS billing, wide vendor selection, rapid deployment options. |
| Cons | Feature depth and pricing vary depending on vendor, best suited for AWS-native workloads. |
| Website | https://aws.amazon.com/marketplace/build-learn/application-performance-monitoring-observability |
Top 12 APM Tools Feature Comparison
| Product | Core Features | User Experience / Quality | Value Proposition | Target Audience | Price Points / Licensing |
|---|---|---|---|---|---|
| Datadog – Application Performance Monitoring | Distributed tracing, service maps, deployment tracking, profiling | Broad integrations, unified UI for traces/logs/metrics | Quick time-to-value, broad ecosystem | Cloud-native & hybrid apps teams | Transparent unit pricing, add-ons increase costs |
| New Relic – All-in-one Observability (includes APM) | 50+ observability capabilities, free data ingest, multiple= editions | Comprehensive features, mature docs | Usage-based pricing, free tier available | Teams needing all-in-one observability | Predictable usage pricing, per-GB costs |
| Dynatrace – Unified Observability with APM | Auto instrumentation, AI root-cause analysis, OpenTelemetry support | Highly automated, strong Kubernetes support | Transparent hourly pricing, AI-driven insights | Enterprise & cloud-native teams | Hourly metering per capability |
| Cisco AppDynamics – APM and Business Transaction Monitoring | Auto discovery, business transaction monitoring, OpenTelemetry | Strong business KPI alignment, enterprise-ready | Clear edition packaging | Large .NET/Java estates | Per-CPU-core pricing, add-ons add cost |
| Splunk Observability Cloud – Splunk APM | No-sample tracing, streaming analytics, continuous profiling | Fast alerting, Kubernetes support, Splunk integration | Handles high-cardinality data well | Large-scale deployments | Host-based pricing, separate SKUs |
| Elastic Observability (Elastic APM) | OpenTelemetry-native, logs/metrics/traces correlation, synthetic monitoring | Flexible scaling, serverless option | Open platform, cost-efficient | Elastic Stack users & cost-conscious teams | Hosted & serverless pricing |
| Grafana Cloud – Application Observability | Traces, logs, metrics, profiling, open-source stack | Transparent pricing, free tier | Open standards, easy onboarding | Open-source users, DevOps teams | Per-host-hour & per-GB pricing |
| Sentry – Performance Monitoring (APM-style spans, profiling) | Spans/traces, continuous profiling, session replays | Developer-friendly UI, simple pay-as-you-go pricing | Competitive pricing for frontend teams | Developers & frontend teams | Usage-based buckets, free monthly volume |
| Honeycomb – Observability with high-cardinality tracing | High-cardinality tracing, BubbleUp analysis, SLOs | Fast debugging, strong docs | Predictable event-volume pricing | Microservices & high-cardinality users | Event-volume tiers |
| IBM Instana Observability – APM and full-stack | Auto service discovery, 1s granularity tracing, AI root cause | SaaS/self-hosted parity, flexible add-ons | Predictable per-MVS pricing | Enterprises needing AI-powered APM | Per MVS unit pricing, add-on metering |
| Azure Monitor – Application Insights (Microsoft Azure) | Distributed tracing, app maps, KQL analytics, OpenTelemetry | Deep diagnostic queries, Azure integration | Native Azure integration & consolidated billing | Azure cloud users | Complex pricing (ingestion, retention, alerting) |
| AWS Marketplace – Observability & APM solutions hub | Curated APM listings, 1-click deploy, private offers | Simplifies procurement, wide vendor selection | Centralized AWS billing, quick deployments | AWS-hosted workloads | Varies by vendor |
Moving Beyond Monitoring to True Observability
Navigating the landscape of modern application performance monitoring tools can feel overwhelming, but as we've explored, the right choice empowers your team to move beyond reactive problem-solving. We've analyzed a dozen leading platforms, from all-in-one observability giants like Datadog and New Relic to specialized, developer-first solutions like Sentry and Honeycomb. The key takeaway is clear: today's best APM tools are not just for watching dashboards; they are for asking complex questions and getting immediate, actionable answers.
The ultimate goal has shifted from simple monitoring (knowing that something is wrong) to true observability (understanding why it's wrong). This evolution is crucial for building resilient, high-performing systems, especially in complex microservices or serverless architectures. The difference is tangible. Instead of seeing a generic "500 error spike," an observability-driven team can instantly correlate that spike with a specific bad deployment, a failing third-party API, or even a single user's unique journey through the application.
Key Takeaways for Selecting Your APM Solution
Making the right decision requires a strategic approach tailored to your organization's unique context. Reflect on the detailed breakdowns of tools like Dynatrace, with its AI-powered root cause analysis, or Elastic APM, which integrates seamlessly into the broader ELK Stack.
To guide your evaluation, consider these critical factors:
- Your Core Use Case: Are you primarily focused on backend API performance, front-end user experience, or both? A tool like Sentry excels at code-level error tracking and performance for developers, while a platform like Cisco AppDynamics is built to connect application metrics directly to business transactions and revenue impact.
- Team Skills and Culture: Does your team prefer a turnkey, AI-assisted solution like Dynatrace, or are they comfortable building and querying with a more flexible, open-source-aligned tool like Grafana Cloud? The best tool is one your team will actually use and integrate into their daily workflows.
- Ecosystem and Integration: Consider your existing tech stack. If you are heavily invested in Microsoft Azure, Application Insights offers native, deep integration. Similarly, if your infrastructure is built on AWS, exploring the APM solutions available in the AWS Marketplace can streamline procurement and billing.
- The Cost of Data: Be mindful of pricing models. Honeycomb’s high-cardinality analysis is powerful but can become costly if you're not strategic about the data you send. Conversely, solutions like Splunk Observability Cloud are priced based on hosts or data usage, requiring you to forecast your needs carefully.
Actionable Next Steps: From Evaluation to Implementation
Choosing a tool is just the first step. To ensure a successful rollout and foster a culture of observability, you need a plan.
- Start with a Proof of Concept (POC): Select your top two or three candidates and run a limited trial. Instrument a single, non-critical service. For example, deploy the Datadog or New Relic agent to a staging environment for an internal-facing microservice. The goal is to evaluate the ease of instrumentation, the quality of the insights generated, and the user-friendliness of the interface.
- Define Your "Golden Signals": Don't just turn on the firehose of data. Work with your engineering teams to identify the key metrics that truly define the health of your application. These typically include latency, traffic, errors, and saturation. Configure your chosen tool to dashboard and alert on these signals first.
- Train and Empower Your Team: An APM tool is useless if only one person knows how to use it. Host training sessions and encourage every engineer to explore traces, create their own dashboards, and set up custom alerts. The value multiplies when the entire team is empowered to diagnose and solve problems independently.
Ultimately, the best application performance monitoring tools serve as a catalyst for cultural change. They break down silos between development, operations, and business teams by providing a shared, data-driven view of application health. As you move forward, choose the platform that not only solves today's performance bottlenecks but also scales with your team’s curiosity and your application’s future complexity.
Before you can monitor your application, you need reliable, high-performance infrastructure to run it on. For teams building applications within the Minecraft ecosystem, finding the right hosting is the critical first step. FindMCPServers offers a curated directory of top-tier Minecraft server hosting providers, ensuring your project is built on a foundation of speed and stability from day one. Explore a world of powerful hosting options at FindMCPServers and give your application the performance it deserves.